
This year has been brutal for Fintech lenders. Rising interest rates and economic uncertainty constrained the availability of funding and increased investor return expectations. Upstart, which funds its originations solely through loan sales to investors and securitizations, was the first lender to stumble. LendingClub benefited from getting a banking charter, but still guided for a decline in revenue and profitability in Q4 2022, and even the almighty Goldman Sachs had to lower the ambitions for its consumer lending arm, Marcus by Goldman Sachs.
SoFi faired better than the others. Thus, in Q3 2022, the company reported strong revenue growth and another quarter of record Adjusted EBITDA. Nevertheless, you can already see the signs of weakening revenue, which was confirmed by management’s guidance of flat revenue growth for the remainder of the year. During the past three years, SoFi has been growing despite strong headwinds (pandemic, student loan moratorium, turbulence in financial markets), so, perhaps, the company’s management will figure out how to continue growing in 2023 as well. “Who dares wins” as they say.
In the meantime, let’s review the company’s Q3 2022 earnings results!
If you are new to SoFi, I suggest reading my previous reviews:
…and if you are new to Popular Fintech, subscribe to receive upcoming updates
Customers
In its consumer segment, SoFi onboarded approximately 424,000 new “members” during the quarter, reaching 4.74 million in total. Over the last four quarters, the company grew its customer base by 1.81 million members, which represents a 61% YoY growth. There was nothing special about this particular quarter in terms of member growth (not the best quarter, not the worst); however, SoFi continues to grow its customer base at an impressive pace despite becoming bigger and bigger, and that’s special on its own.

Using the reported number of “products” as a proxy for member growth, we can conclude that the growth came from SoFi Relay (+256K products during the quarter), SoFi Money (+165K products), SoFi Invest (+106K products), and lending products (+78K products). As a reminder, don’t try to sum the number of products, as a single member can use multiple products. Interestingly, the number of SoFi credit cards increased by just over 14K during the quarter, despite the strong performance reported by other credit card issuers.
In its technology segment, SoFi reported 124.3 million Galileo accounts at the end of the quarter, which represents a 40% growth compared to Q3 2021. Galileo added 7.8 million accounts in Q3 2022, and 35.5 million accounts during the last year. Continued growth in Galileo accounts is a surprising factor, as I would expect the growth to slow down. It looks like Galileo’s customers are not constrained by the funding availability, and confidently invest in launching and scaling new card programs.
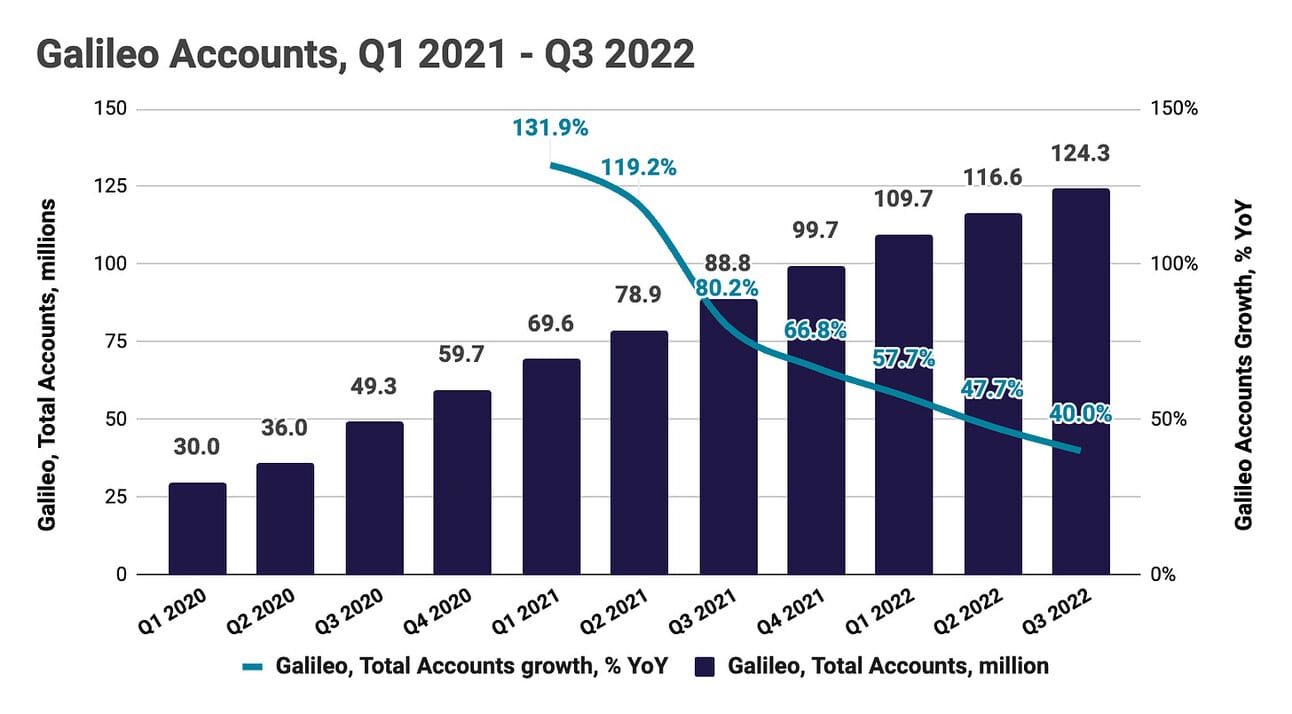
The company is still not disclosing any operational metrics for Technisys (i.e. ARR, number of clients, etc.), so the picture of SoFi’s technology segment only represents the performance of Galileo. As a reminder, in March 2022 SoFi acquired a core banking solution provider Technisys for approximately $913 million.
Loan originations
SoFi reported $3.48 billion in loan originations in Q3 2022, which represents a 2.4% increase compared to Q3 2021, and an 8.8% increase compared to Q2 2022. Student loan originations declined 52.8% YoY and increased by 14.7% QoQ, personal loan originations increased by 71.3% YoY and 13.7% QoQ, and home loan originations declined by 72.7% YoY and 34.9% QoQ. As the chart below illustrates, SoFi avoided posting a third sequential quarter of originations declines.
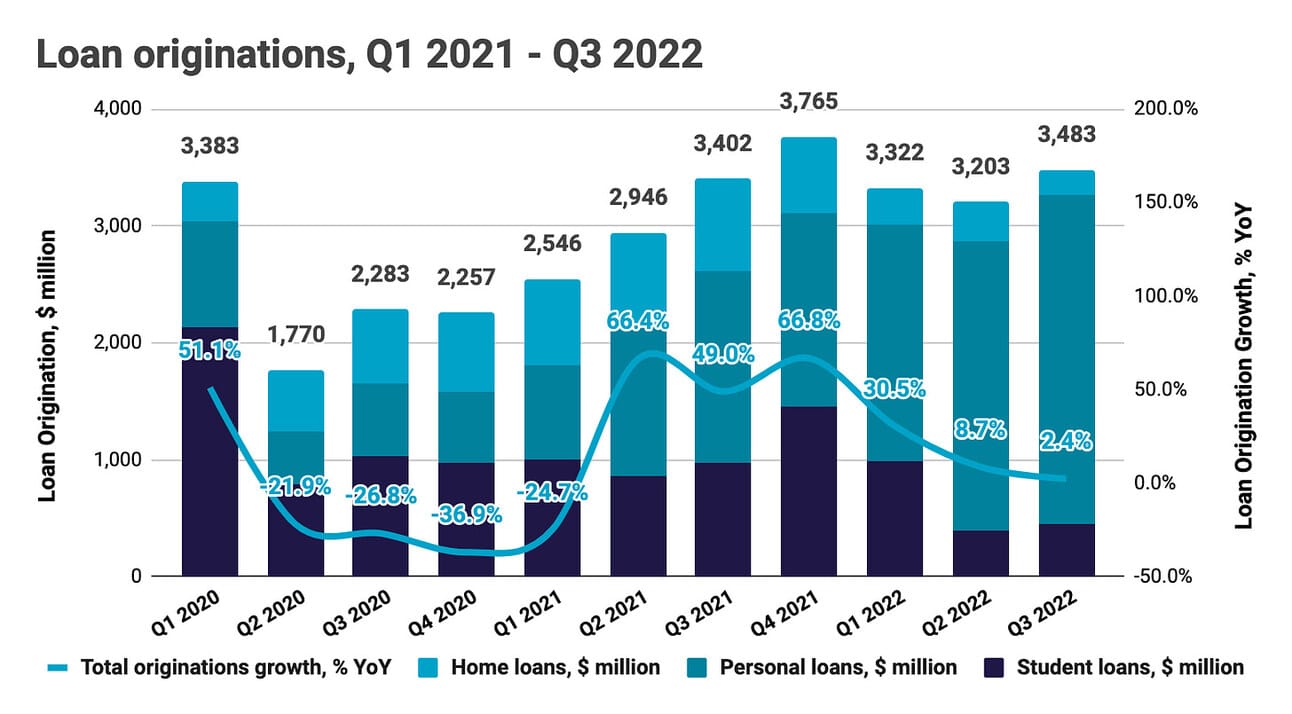
Two comments on the origination volumes. First, SoFi (again) managed to further boost personal loan origination volumes. A year ago, in Q3 2021, the company originated $1.64 billion in personal loans, which represented 48% of total originations. In Q3 2022, SoFi personal loan originations increased to $2.81 billion and represented 81% of total originations. While student loan originations were suppressed by the student loan moratorium, SoFi managed to build a strong personal loan business franchise.
Second, the company finally got clarity on the student loan moratorium: the moratorium will end by the end of the year. The end of the moratorium is expected to revive SoFi student lending business, which used to be at the core of the company’s revenue. At its peak (in Q4 2019), SoFi originated $2.44 billion in student loans during a quarter. We, of course, are yet to see if the current interest rates environment will allow SoFi to restore previous might in student lending, but this should provide at least some boost to the origination volumes.
Loan Portfolio and Deposits
SoFi reported $11.2 billion in loans at fair value and amortized cost at the end of Q3 2022, which represents a 130.3% increase compared to Q3 2021 and a 36.4% increase compared to Q2 2022. As can be seen from the breakdown below, the growth came from SoFi retaining personal and student loans on its balance sheet, as well as growing its credit card business. At the same time, the balances of securitized loans and on-balance-sheet home loans declined.
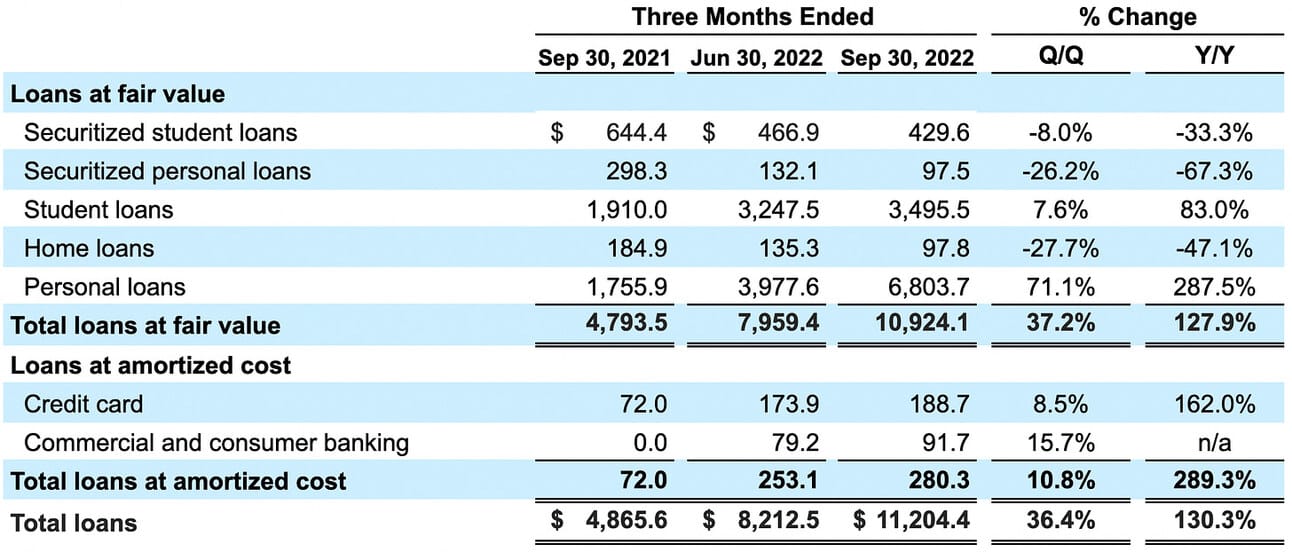
In absolute terms, the company’s loan book increased by $2.99 billion during the quarter. The increase is the result of $3.48 billion in originations - $0.73 billion in principal repayments - $1.08 billion in loan sales + $1.28 billion in loan repurchases + a few other minor factors (such as accumulated interest). In Q3 2022, SoFi decided to repurchase $129.7 million of securitized loans and $1.14 billion of non-securitized loans. As per the company’s quarterly filing, SoFi was not required to purchase these loans, the management elected to do it.
On the liabilities side, SoFi finished Q3 2022 with $5.03 billion in deposits, up 85.5% or $2.32 billion, from the previous quarter. As you can see, SoFi is not shy of offering its depositors optionality, including demand and time deposits, as well as savings accounts. Like LendingClub or Marcus by Goldman Sachs, SoFi offers some of the highest rates on its deposit products, as it needs deposits to fund loan originations. Nevertheless, growth in deposits was short of the increase in the loan book ($2.32 vs $2.99 billion), so SoFi used debt to finance the remaining part.

In summary, SoFi is growing its loan portfolio faster than anticipated at the beginning of the year, either because of the weakening demand from loan buyers or because of exceeding its forecasts for attracting deposits (or both). I also think that loan repurchases from investors is something that should be monitored closely, as I don’t fully understand why SoFi made that repurchase, and why such an approach to growing the loan portfolio was never communicated before.
Revenue
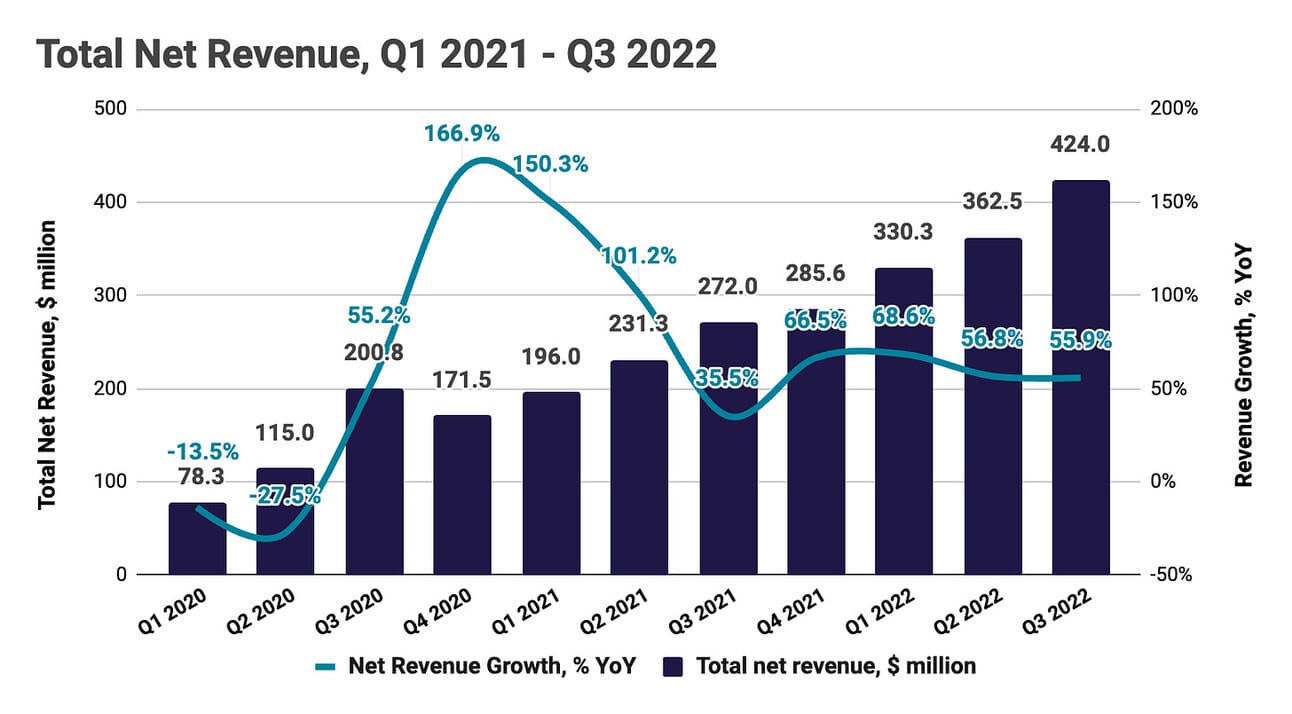
SoFi reported net revenue of $424.0 million for the quarter, which represents a 55.9% growth compared to Q3 2021, and a 17.0% growth compared to Q2 2022. Net interest income grew 118.1% YoY, and 28.6% QoQ, and Non-Interest income grew 33.3% YoY and 11.0% QoQ. In Q3 2022, Net interest income contributed 37.2% of the total net revenue, up from 26.6% a year ago. In absolute terms, Net Interest Income contributed $85.5 million, and Non-Interest Income contributed $66.5 million, to the total revenue increase of $152.0 compared to Q3 2021.
Net interest income is a function of the interest-earning assets and Net Interest Margin. SoFi increased average balances of the interest-earning assets from $6.3 billion in Q3 2021 to $10.7 billion in Q3 2022, primarily, by retaining more loans on its balance sheet. At the same time, the Net Interest Margin increased from 4.59% in Q3 2021 to 5.86% in Q3 2022. In the table below, you can see that the growth in interest income outpaced the growth in interest expenses, which is the same as the increase in NIM. Interest-earning assets will continue to grow, as the company builds its loan portfolio, but the development of NIM is something to watch closely.

Non-interest income is trickier. “Loan origination and sales”, the largest component of Non-Interest Income, used to primarily include fees from sales of loans and fair value adjustment of the loans held on the balance sheet. However, in Q3 2022, the key drivers of this income stream became interest rate swaps and loan write-offs. Loan origination income and fair value adjustments declined by $45.2 million compared to Q3 2021, and loan write-offs increased by $22.2 million, but that was all offset by income from hedging interest rates.
“Technology products and solutions” income, the second largest component of Non-Interest Income, increased by $32.0 million compared to Q3 2021, which was driven by a $13.5 million increase in Galileo income, and an $18.5 million contribution from consolidating Technisys revenue. “Technology products and solutions” revenue was almost flat compared to the previous quarter ($81.7 million in Q2 2022 vs $82.0 million in Q3 2022), which is partially explained by a decline in contribution from Technisys ($20.3 million in Q2 2022 vs. $18.5 million in Q3 2022).
If you want to reconcile segment reporting (chart below) with the consolidated P&L, keep in mind, that under the segment reporting, the “Financial services” segment revenue includes part of the lending revenue (SoFi Credit Card), as well as interest income from internal pricing of deposits (“Financial services” sell deposits to SoFi’s treasury, which, in turn, sells those deposits to the “Lending” segment). In Q3 2022, out of the total segment’s revenue of $48.9 million, $20.8 million came in from non-interest income (up from $11.4 million a year ago), and $28.2 million came from interest income (up from $1.2 million a year ago).
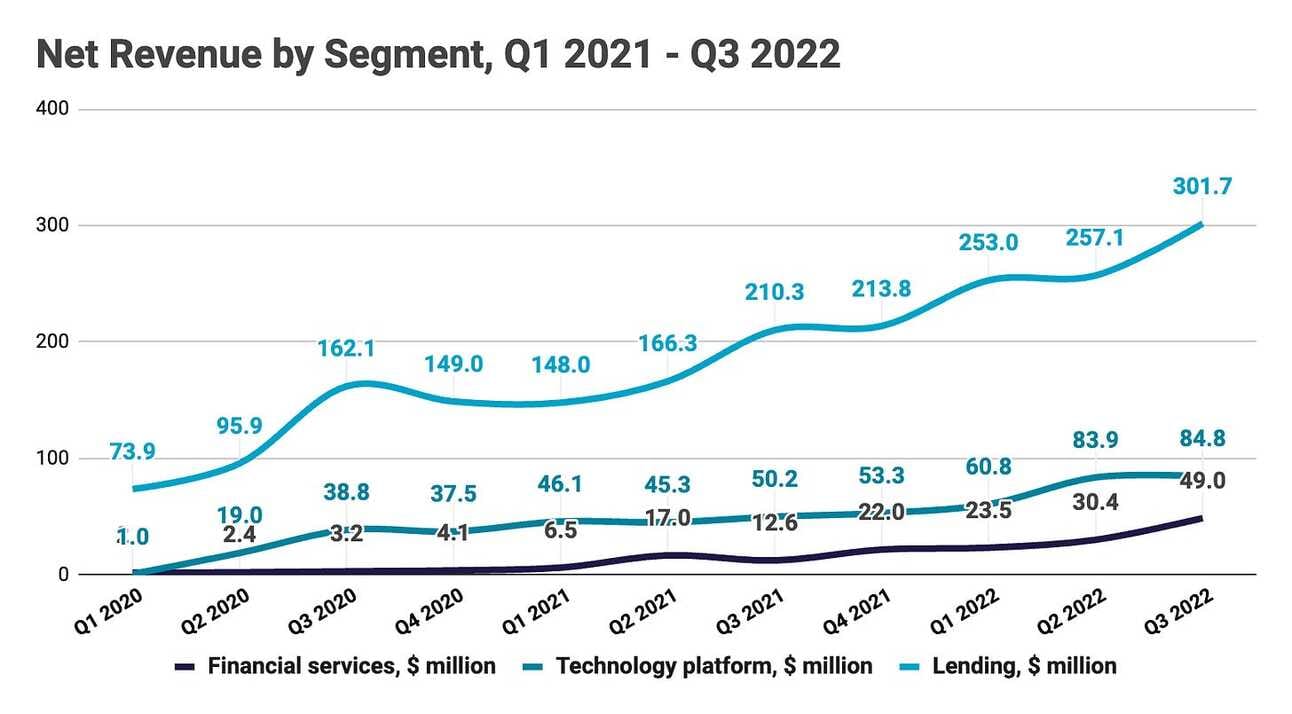
In summary, SoFi delivered strong revenue growth; however, you can find weaknesses under the hood. Thus, Non-Interest income was driven by successful hedging efforts, rather than growth in loan sales, the Technology segment revenue was almost flat sequentially, and the Financial Services segment revenue was primarily driven by the implementation of internal pricing (creating income from deposits “sold” to treasury). I’d guess the growth driver going forward will be the Lending Segment and the Net Interest Income it generates.
The company’s management guided for $1,517-1,522 in "Adjusted Net Revenue” (GAAP revenue adjusted for changes in the valuation of servicing rights and residuals of securitizations) for the full year, which translates to $420-$425 million Adjusted Net Revenue in Q4 2022 and would represent a 50-51% growth compared to Q4 2021 and 0.4 - 1.2% growth compared to Q3 2021.
Operating Expenses
The company reported $498.4 million in non-interest expenses for the quarter, which represents a 65.1% increase compared to Q3 2021, and an 8.8% increase compared to Q2 2022. Loss before income taxes was $74.5 million, compared to a loss before income taxes of $29.9 million a year ago. Please note that in Q3 2021, operating expenses, and in particular “General and administrative”, were positively impacted by a $64.4 million gain in the fair value of SoFi warrants. Excluding the impact of the warrants, non-interest expenses grew 36% YoY.

The efficiency or cost-to-income ratio (non-interest expense as a percentage of net revenue) continues to improve, declining from its peak of 190% in Q1 2021 to 118% in Q3 2022. However, it is still way above the 61.7% average for the U.S. banking industry, and the key question is if the ratio will continue to decline further given the guidance of flat revenue growth ahead (at least in the coming quarter). Should the company’s management pursue the ambition to cut costs, they will face an uneasy decision on where to cut, with marketing and salaries (including share-based compensation) being the most likely candidates.

Operating expenses include share-based compensation of $77.9 million, which increased by 7.2% from $72.7 million in Q3 2021. In relative terms, share-based compensation in Q3 2022 stood at 18.4% of the net revenue, compared to 26.7% of the net revenue in Q3 2021. SoFi estimates the cost of unvested share-based compensation instruments (stock options, restricted stock units, and performance stock units) to be $669 million, which will be recognized over the next 3 years (so approximately $55 - 60 million per quarter excluding new grants).
I am also still not buying the idea of the synergies between the lending and financial services business and the technology segment (Galileo and Technisys). With the logic of controlling the full stack, all banks would need to buy their vendors, which is far from being the case. Thus, if the times get tough, perhaps, SoFi will revisit its investments in the technology segment, which might include merging and scaling down Galileo and Technisys, or even divestment.
In short, I believe SoFi will need to continue showing progress toward improving operating efficiency (with the ultimate goal of reaching GAAP profitability). However, if the revenue growth decelerates, the only way to reach that would be to cut costs.
Net Income and Adjusted EBITDA
SoFi reported a Net loss of $74.2 million for the quarter, an increase from a Net loss of $30.0 million in Q3 2021. As noted earlier in the text, Q3 2021 results were positively impacted by a $64.4 million gain in the fair value of warrant liabilities. Excluding this impact, Net loss decreased compared to Q3 2021.

The company reported an Adjusted EBITDA of $44.3 million for the quarter, an increase from $10.3 million in Q3 2021, and $20.3 million in Q2 2022. As can be seen from the breakdown below, key adjustments made in calculating Adjusted EBITDA were share-based compensation ($77.9 million), as well as depreciation and amortization ($40.3 million).
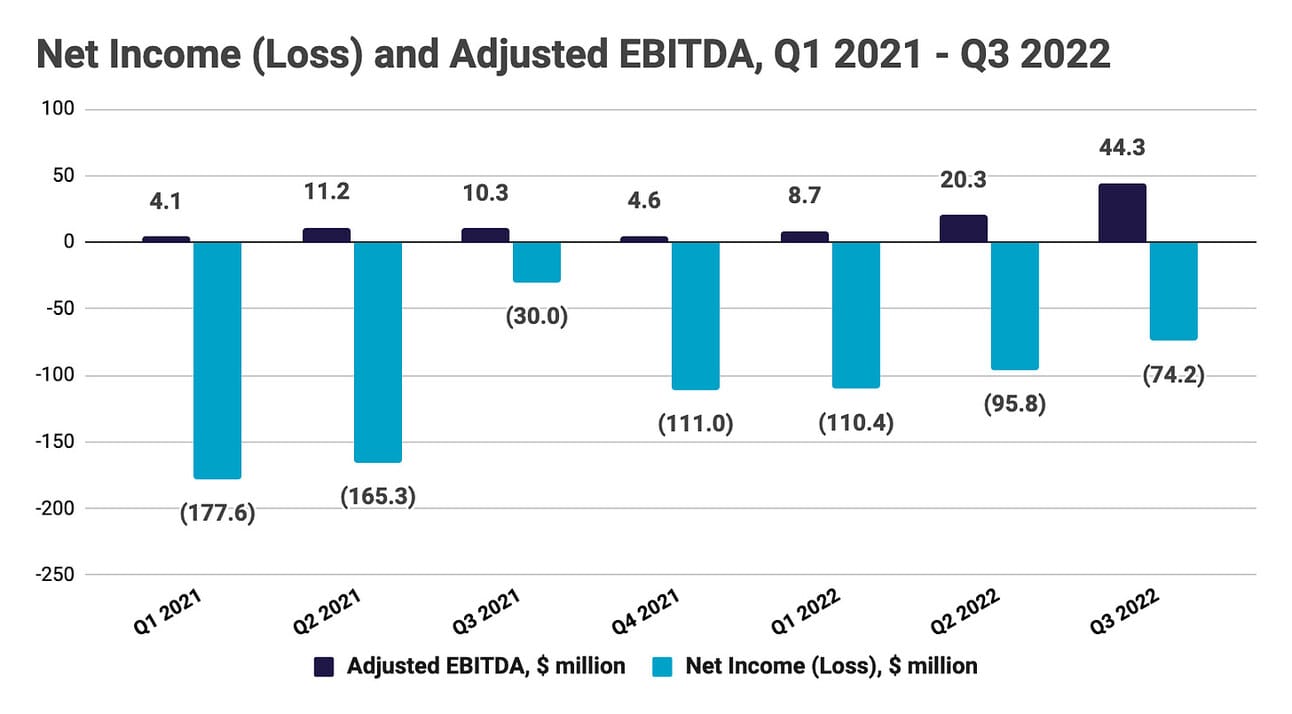
The company’s management guided for $115-120 million in Adjusted EBITDA for the full year, which translates to $42-47 million in Adjusted EBITDA in Q4 2022, or zero sequential growth at the midpoint of the guidance.
Things to Watch
Student loan origination. The student loan moratorium will finally expire at the end of the year, which is expected to be a strong tailwind for SoFi’s lending business. Student loan refinancing used to be the bread and butter of the company, so let’s see if the company can get back its might in this segment. However, the rising interest rates could make refinancing less attractive than it used to be, so let’s not get overly excited and wait for the results.
Net Interest Income. As per my points above, non-interest income growth will greatly moderate in the coming quarter (i.e. technology revenue was flat sequentially, and the growth in loan sales income was purely a result of hedging efforts). Thus, I would expect Net Interest Income to become the key revenue driver. We should watch for further growth in interest-bearing assets (mostly loans on the balance sheet) and the evolution of the Net Interest Margin.
2023 Guidance. At the next earnings call (in early February), I would expect the company’s management to provide 2023 guidance. Over the last three years, SoFi faced numerous challenges (pandemic, student loan moratorium, turbulence in financial markets), and 2023 might bring a new challenge in the form of economic recession. However, if the recession turns out to be milder than expected, SoFi will be well-positioned to operate at full strength.
Path to GAAP profitability. Finally, the next logical step for SoFi would be to become GAAP profitable. I don’t know if the company’s management will pursue this ambition already in 2023 or in 2024, but in any case, this will not be an easy endeavor. The revenue growth next year will be challenging, and the company still operates at the cost to income ratio of above 100%. On the other hand, achieving GAAP profitability would send a strong signal to investors, that SoFi is here to stay.
In summary, it was another strong quarter for SoFi, and despite weakening revenue drivers, the company faired much better than other players in the space. Nevertheless, economic recessions do not treat lenders well, so I would expect SoFi to face strong headwinds on its next milestone - reaching GAAP profitability.
Source of the data used above: Investor Relations
Disclosure & Disclaimer: despite rocky performance in 2021 and the first half of 2022, I have open positions in most of the companies covered in this newsletter (including SoFi), as I am extremely bullish on the transformation in the financial services industry. However, none of the above is financial advice, and you should do your research.