
Earlier in the month, SoFi sued the U.S. government for extending the student loan repayment moratorium. The move seems controversial, as the moratorium impacts only federal student loans, and SoFi is essentially suing the government (which is trying to do a good thing) for creating challenges to its loan refinancing business. However, I believe the company’s management decided to stand up to its shareholders. SoFi plans to finally reach GAAP profitability, and this plan assumes that the student loan repayment moratorium finally ends in 2023. SoFi has been in business for more than a decade, it is a public company and even holds a banking charter now…it is time to end the “adjusted” profitability period.
The company’s management guided for an Adjusted EBITDA of $40-45 million in Q1 2023, and $260-280 million for the full year 2023, which would represent an impressive leap compared to 2022 results. SoFi also plans to reach GAAP profitability in Q4 2023. However, I would expect the company’s personal loan business, which was the key growth driver in 2021 and 2022, to face strong headwinds in 2023. Moreover, we should not expect the Technology to contribute meaningfully to growth, while the company repositions from Fintech clients to more established players. Thus, SoFi needs its student lending business to return to growth to deliver on 2023 guidance and that GAAP profitability promise. Let’s see how this plays out!
If you are new to SoFi, I suggest reading my previous reviews:
Customers
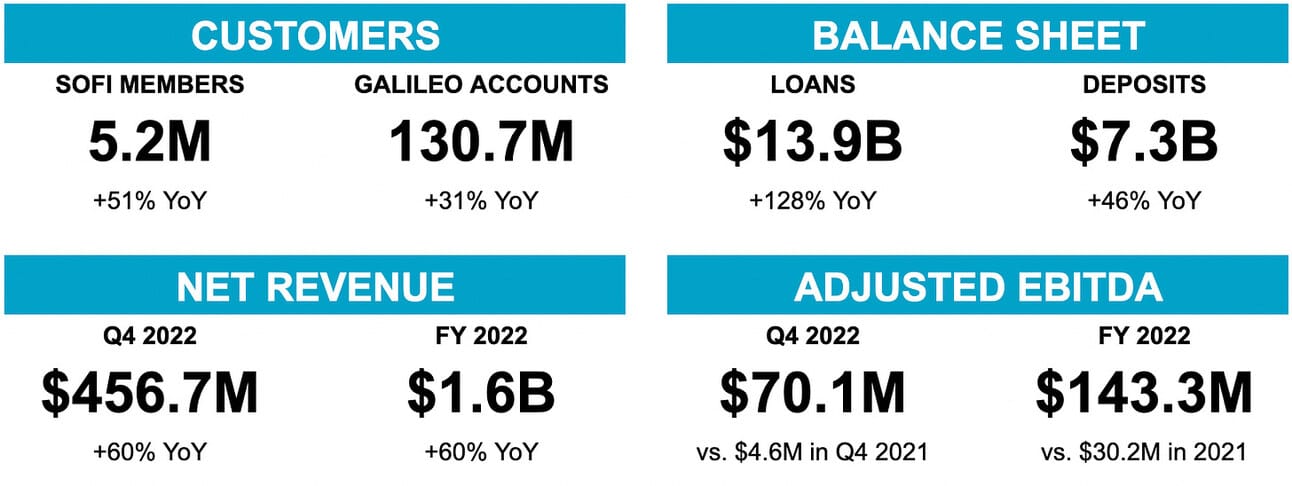
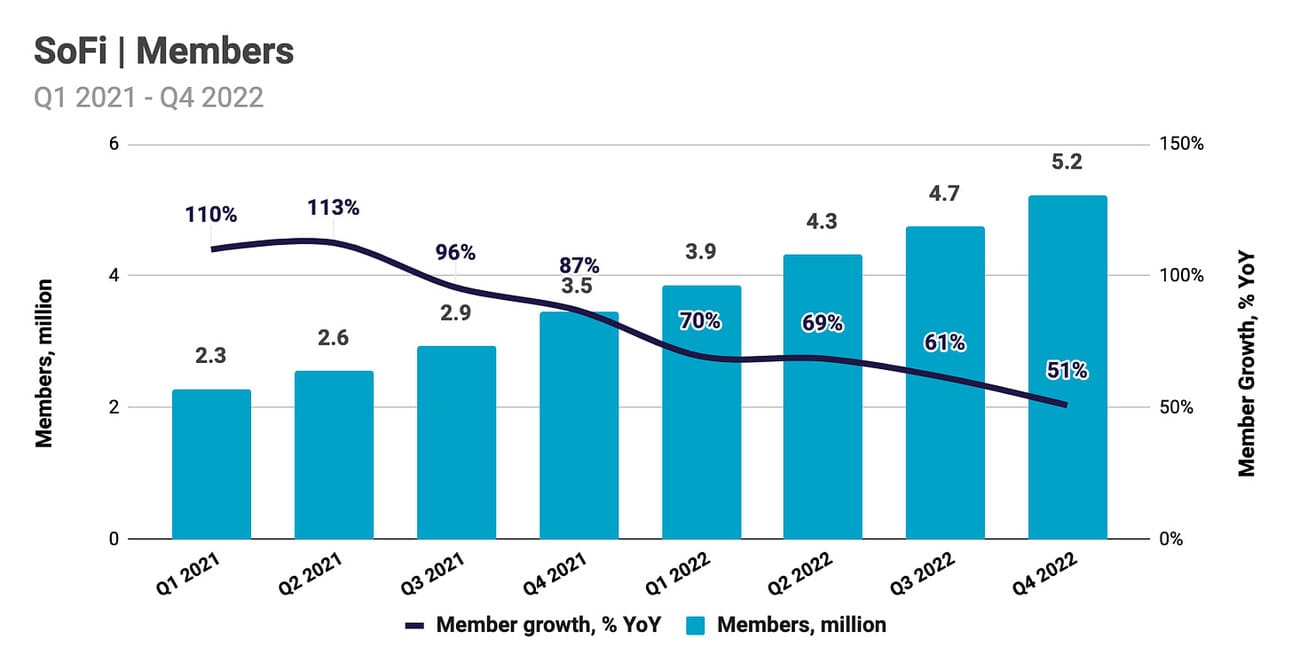
In its consumer segment, SoFi onboarded almost 480,000 new “members” during Q4 2022, reaching a total of 5.2 million. The company’s total customer base increased by 51.0% compared to Q4 2021. The reported number of “products”, which can be used to identify drivers behind member growth, suggests that the growth came from SoFi Relay (+321K products in the quarter), SoFi Money (+193K products), SoFi Invest (+91K products), Lending products, incl. referred loans (+64K products) and SoFi Credit Card (+17K products). One member can use multiple products; thus, the total increase in “products” exceeds the increase in “members”.
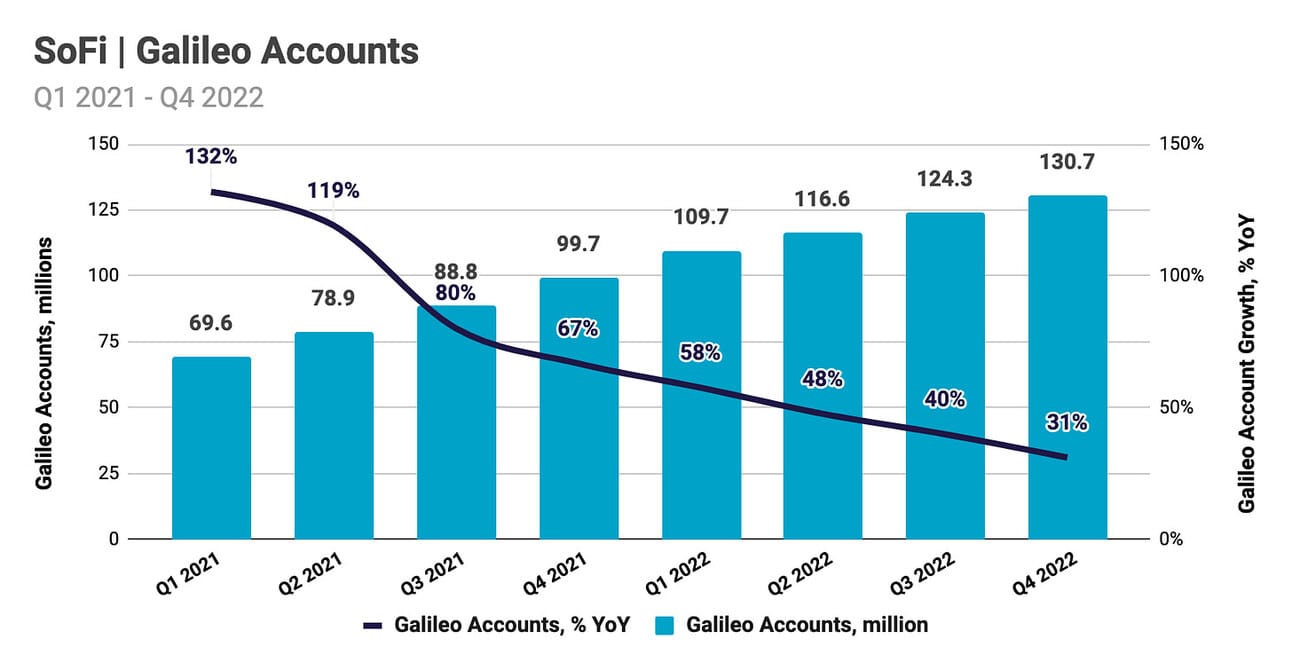
In its technology segment, SoFi added approximately 6.4 million Galileo accounts during the quarter, bringing the total to 130.7 million accounts. This represents a 31.1% increase compared to Q4 2021. Technisys, the core banking solution provider that SoFi acquired in March 2022, does not charge its clients based on the number of serviced accounts (and instead, uses a more “traditional” enterprise pricing model); thus, the company does not report those separately. In Q4 2022, Galileo signed 11 new clients, and Technisys signed 16 new clients. The company also launched “Pay in 4”, the first product “built on the combined Galileo and Technisys platform.”
In the short term, growth in “members” is important for the company to attract deposits, which are a cheap funding source. SoFi generates most of its revenue from lending products; thus, growth in “members” does not immediately translate into growth of revenue (as mentioned above, only 64K out of 480K new “members” used SoFi’s lending products in Q4 2022). In the longer term, a larger customer base represents a potential to upsell products and services. However, SoFi uses a policy of “once a member, always a member”, and does not disclose what percentage of the 5.2 million “members” that it onboarded over the years is still active.
Loan Originations
SoFi reported $2.98 billion in loan originations in Q4 2022, which represents a 20.9% decline compared to Q4 2021, and a 14.5% decline compared to Q3 2021. Personal loan originations were $2.47 billion, which represents a 49.8% increase compared to Q4 2021, but a 12.2% decline compared to Q3 2022. Student loan originations declined 72.2% compared to Q4 2021 and 11.2% compared to Q3 2021, while home loans declined 83.9% compared to Q4 2021 and 51.2% compared to Q3 2021. Personal loans represented 82.8% of total originations, compared to 43.7% in Q4 2021, and 27.2% in Q4 2020.

In its 2023 guidance, the company’s management assumed that the student loan repayment moratorium will finally expire in June 2023, and then it will take until September 2023 for the repayments to resume. Also, given where the mortgage rates are, we should not expect a material improvement in SoFi’s home loan origination volumes anytime soon. Consequently, in Q1-Q3 2023 the company’s origination volumes will be primarily driven by personal loan volumes, and we should expect meaningful growth in student loan origination volumes in Q4 2023 (if the student loan repayment moratorium is not prolonged again).
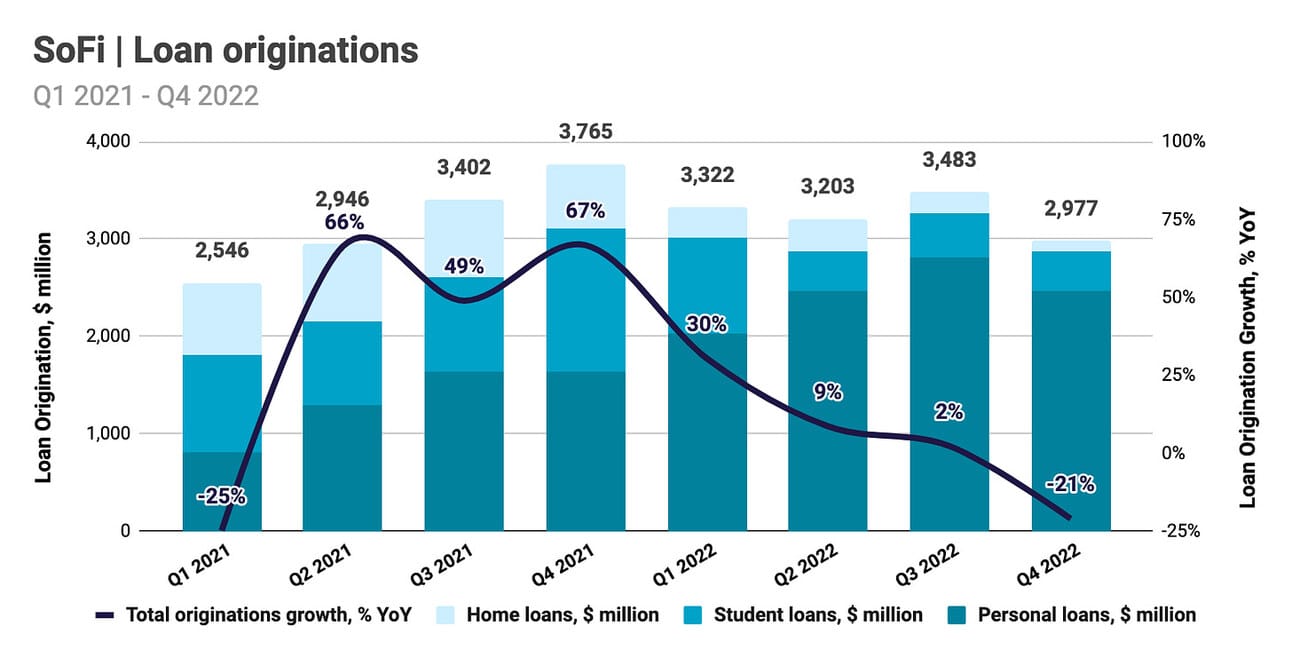
In my previous review, I highlighted that SoFi was the last personal lender, which continued to grow origination volumes in Q3 2022. Thus, Upstart’s origination volumes peaked in Q1 2022, and LendingClub’s origination volumes peaked in Q2 2022. It seems now that SoFi’s originations volumes peaked in Q3 2022, especially if you consider personal loan originations only (see the chart below). The downward trend will continue at least into Q1 2023, with LendingClub guiding for a further decline in originations to $1.9-2.2 billion, and Upstart’s revenue guidance implying a decline in originations to approximately $1 billion.
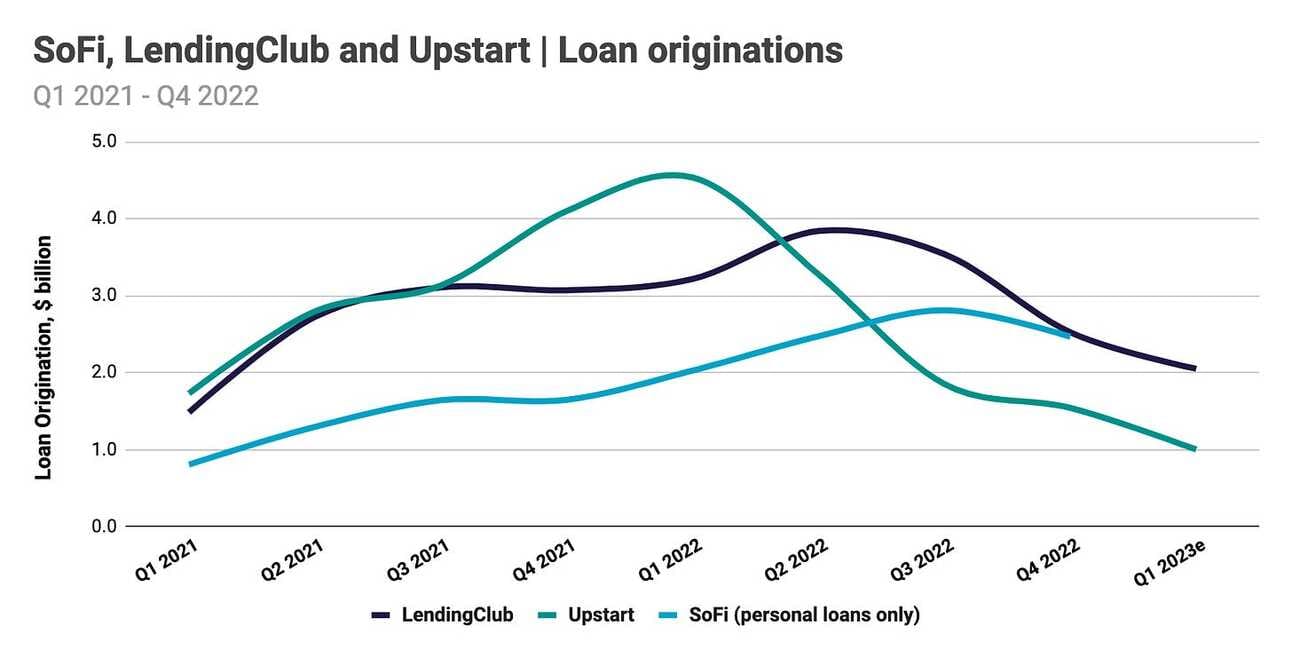
If we use LendingClub and Upstart guidelines as the basis, then it is reasonable to expect SoFi to originate $1.50-1.75 billion in personal loans and $2.00 - 2.25 billion across all loan types (assuming student and home loan originations do not deteriorate further from Q4 2022 levels). The company has accumulated a large enough loan portfolio to meet its Q1 2023 revenue guidance even with these origination volumes. However, a prolonged period of muted loan originations will eventually translate into slower growth in revenue (especially, if the student debt moratorium is extended again beyond June 2023).
Loan Portfolio and Deposits
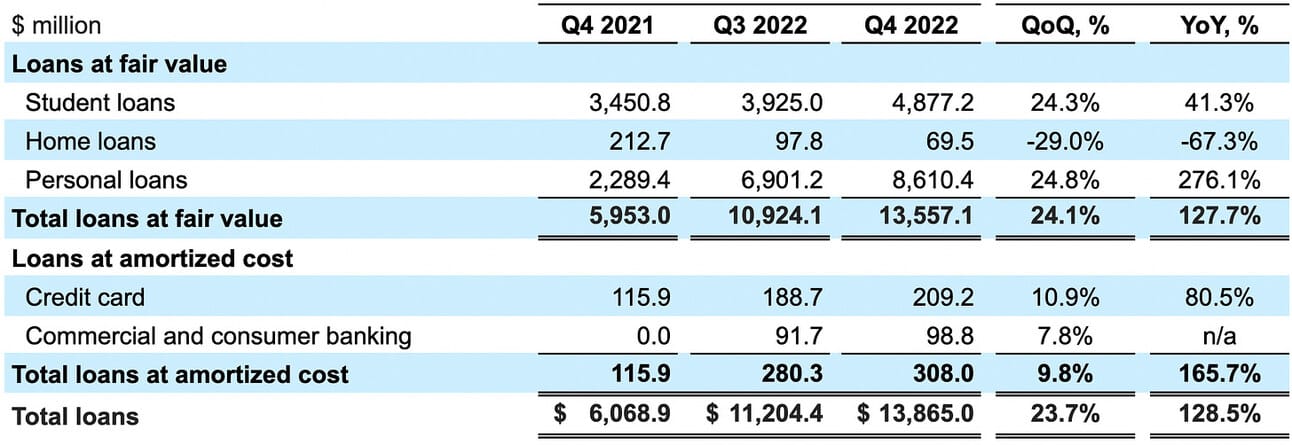
SoFi reported a $13.9 billion loan portfolio on its balance sheet at the end of Q4 2022, which represents a 128.5% increase compared to Q4 2021, and a 23.7% increase compared to Q3 2021. The biggest contributors to SoFi’s loan portfolio growth were personal loans, which increased from $2.29 billion at the end of 2021 to $8.61 billion at the end of 2022, and student loans, which increased from $3.45 billion at the end of 2021 to $4.88 billion at the end of 2022. The company sells most of the home loans it originates, so there is no “accumulation” of home loans on the company’s balance sheet.
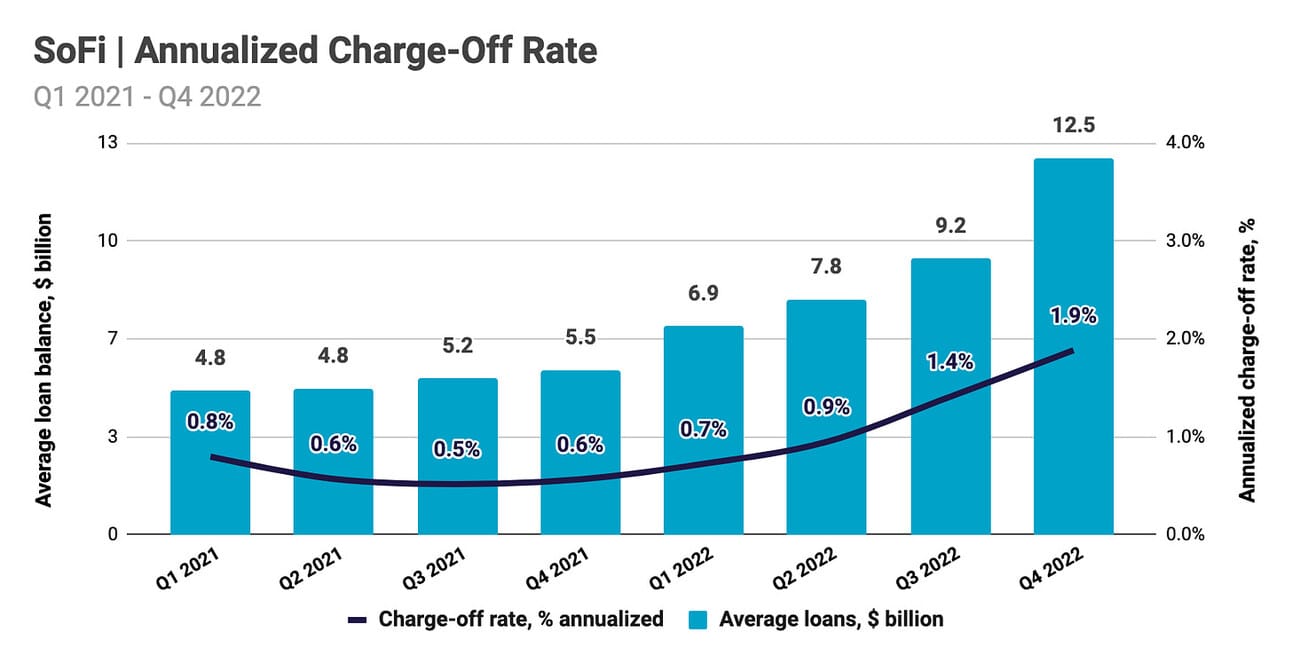
SoFi reported $58.8 million in net charge-offs (charge-offs less recoveries) for the quarter, compared to $7.7 million in Q4 2021. The increase in net charge-offs is the result of a larger loan portfolio and higher charge-off rates. Thus, the average annualized charge-off rate increased from 0.6% in Q4 2021 to 1.9% in Q4 2022 (2.47% for personal loans, and 0.37% for student loans). The company’s management expects charge-off rates to “revert over time to more normalized pre-pandemic levels”, which means they expect charge-offs to continue trending higher. Charge-off rates for the industry as a whole are still below their pre-pandemic levels.
SoFi reported $7.34 billion in deposits at the end of Q4 2022, which represents a 45.9% increase compared to Q3 2022. As a reminder, SoFi completed the acquisition of Golden Pacific Bancorp in February 2022; thus, there were no deposits on the company’s balance sheet in Q4 2021. SoFi continued to tap into its member base for deposits; thus, according to the company’s CEO, “of the $7.3 billion in deposits at quarter end, 88% were from direct deposit members.” A strong customer base (as a source of deposits) is a material differentiator for the company (i.e. LendingClub is using high-yield savings accounts to fund originations).

In addition to deposits, SoFi uses other sources of funding to fund loans (such as warehouse funding, which allows the company to accumulate loans before selling them off to investors). Per the earnings call comments, deposits are a cheaper source of capital, and “in Q4 [2022], the difference in our deposit cost of funds and warehouse cost of funds was approximately 190 basis points.” However, as you can see from the chart below, SoFi increased the usage of debt in both Q3 2022 and Q4 2022 (vs. replacing debt with cheaper deposits). The company decided to aggressively scale its loan portfolio, and fuel further growth with interest income.
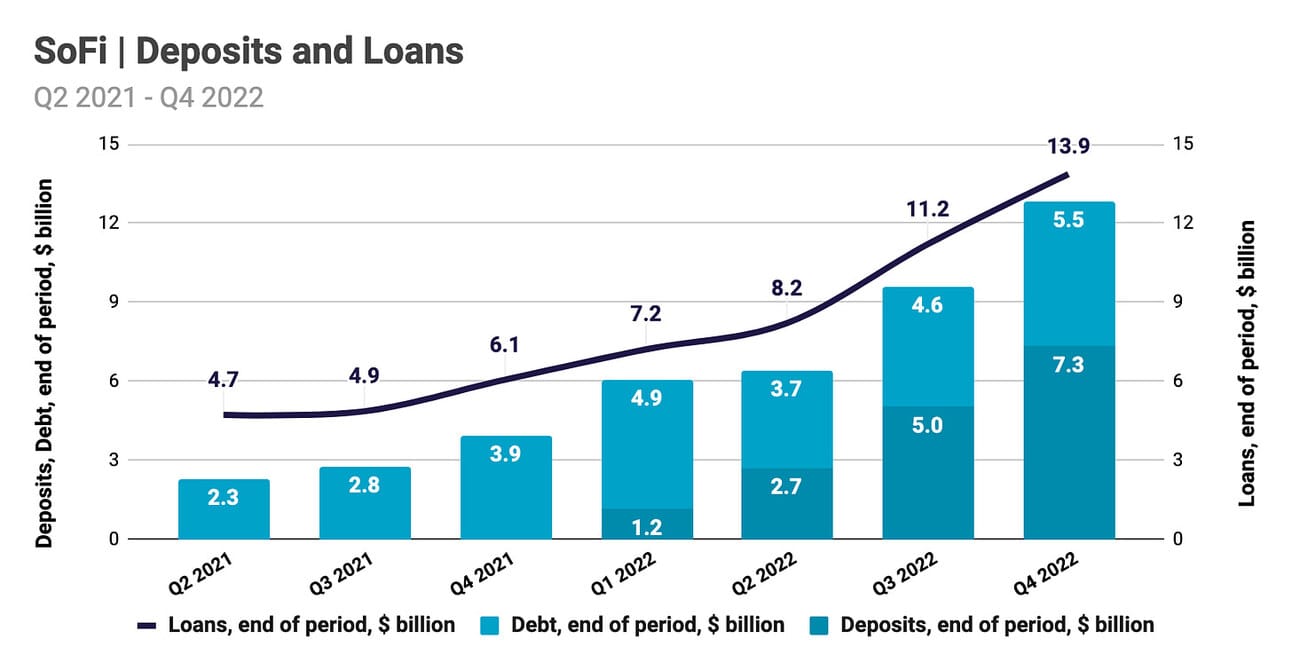
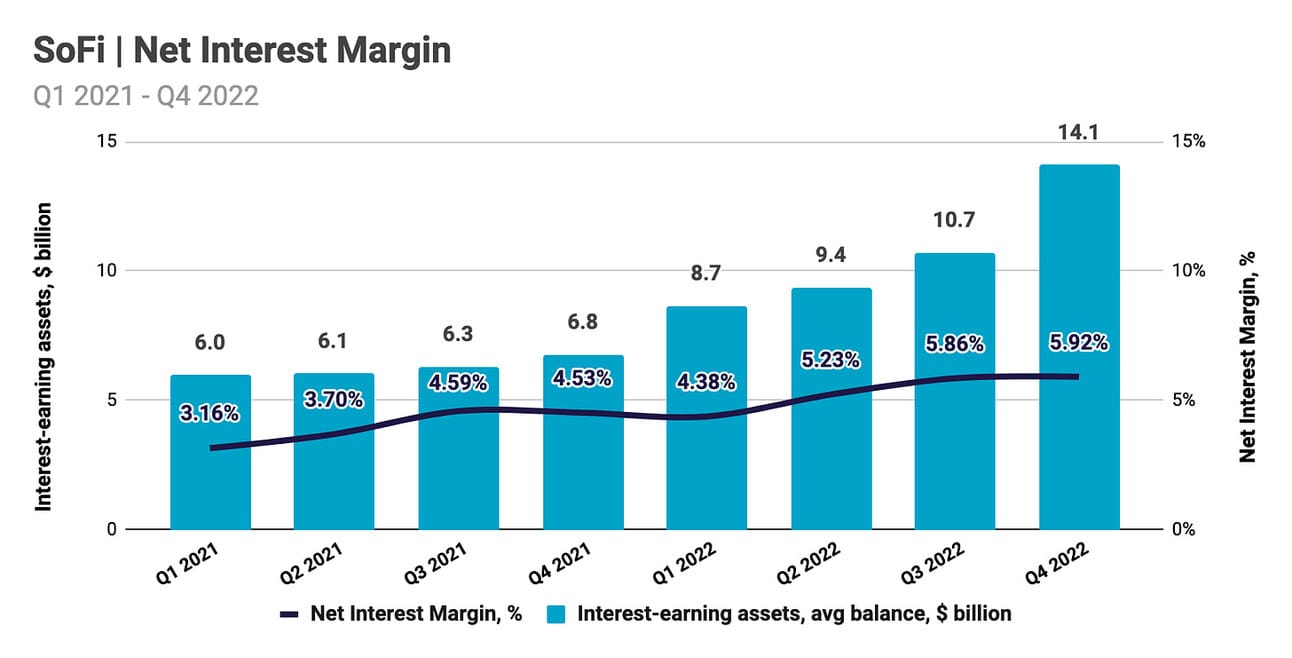
Loans and cash held at other banks comprise the company’s “interest-earing assets”, while deposits and debt comprise the “interest-bearing liabilities.” The share of personal loans in the company’s loan portfolio increased substantially in 2022 (from 37.7% in Q4 2021 to 62.1% in Q4 2022), which translated into a higher yield on assets. In addition, as the company started using deposits to fund loans, and the share of deposits in the total funding increased, the total cost of funding declined. The combination of the two factors strongly improved the Net Interest Margin in 2022; however, I would expect muted improvement to NIM in 2023.
Net Revenue
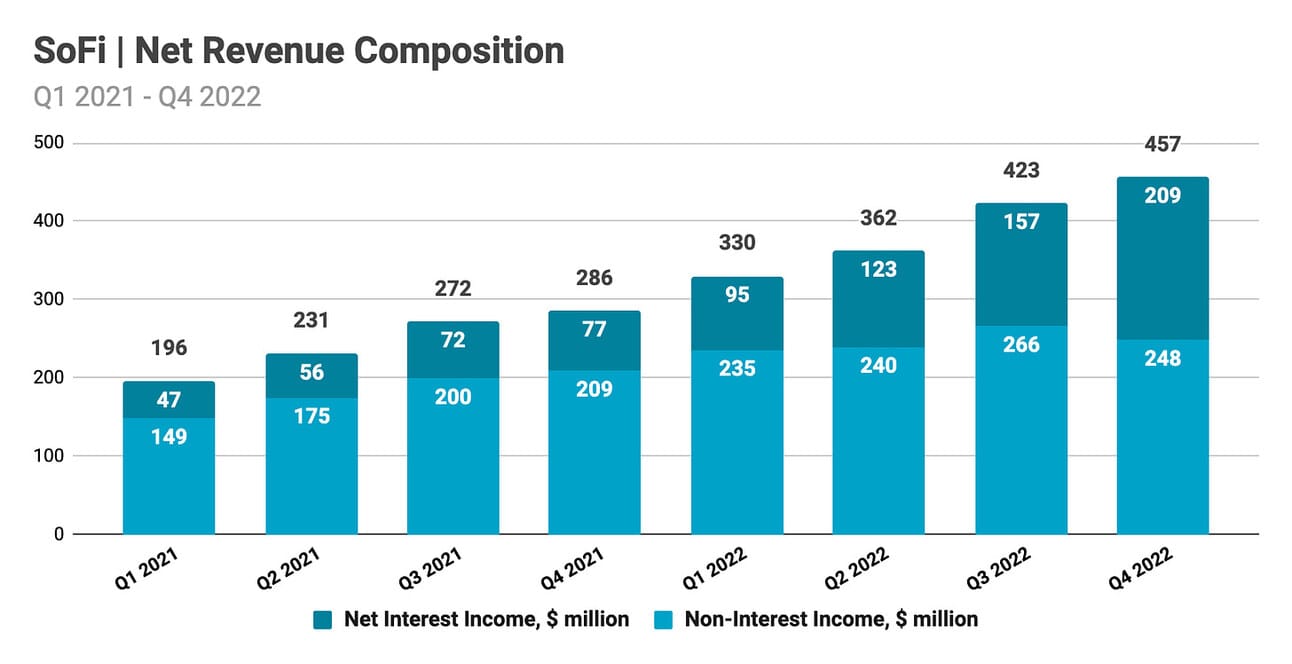
SoFi reported $456.7 million in total net revenue for the quarter, which represents a 59.9% increase compared to Q4 2021, and a 7.7% increase compared to Q3 2022. Net interest income contributed $208.6 million and increased 172.4% compared to Q4 2021, and 32.1% compared to Q3 2022. Non-interest income contributed $248.1 million and increased 18.7% compared to Q4 2021, but declined 6.8% compared to Q3 2022. Net interest income contributed 45.7% of the total net revenue, compared to 26.7% in Q4 2021 and 22.6% in Q4 2020.
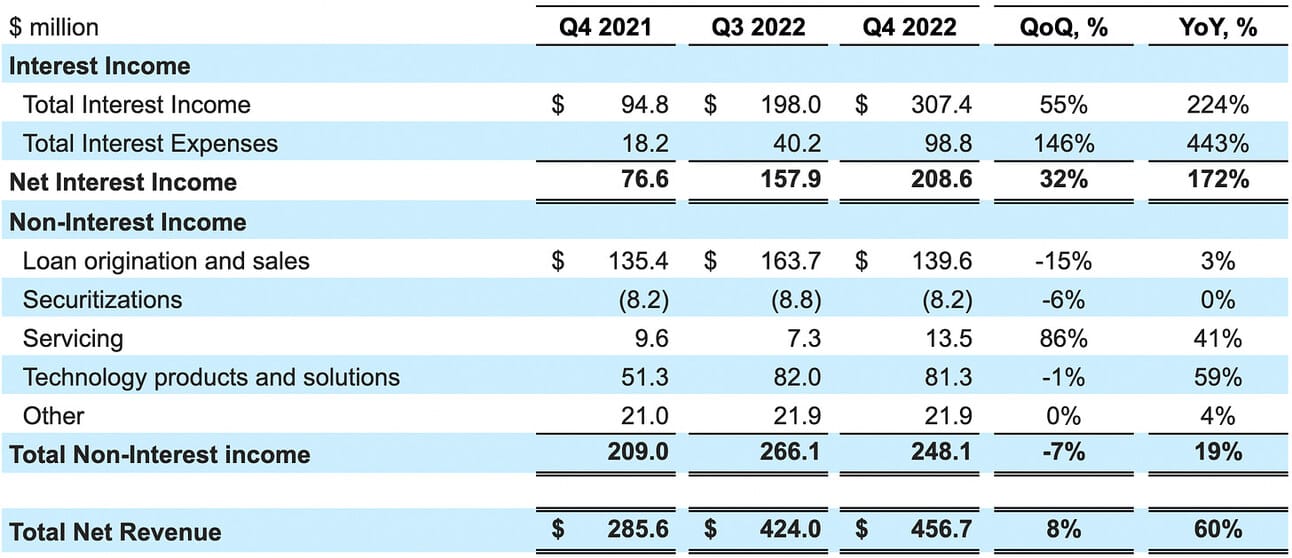
The company’s management guided for $430-440 million in Adjusted revenue in Q1 2023, which represents a 34-37% increase compared to Q1 2022, and $1.93 - 2.00 billion in Adjusted revenue for the full year 2023, which represents a 25-30% increase compared to 2022. In order to calculate Adjusted revenue, the company adjusts GAAP net revenue with the changes in the fair value of servicing rights and residual interest in securitizations. In 2022, these adjustments varied from $6.4 to $13.3 million ($8.3 million on average); thus, we can translate the Q1 2023 guidance into (non-adjusted) revenue of approx. $440-450 million.
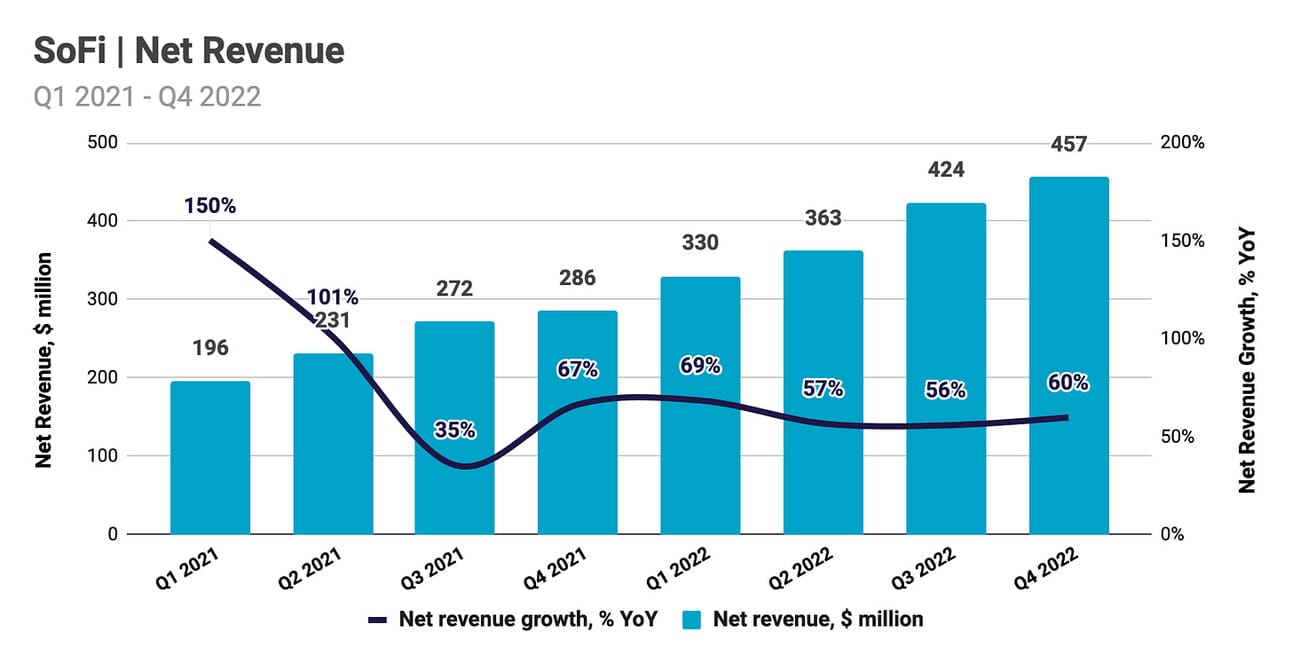
As noted earlier, non-interest income declined sequentially, so the growth in net revenue in Q4 2022 is fully attributable to the growth in net interest income, which, in turn, was primarily a result of the growth in interest-earning assets. Thus, the average balance of interest-earning assets (primarily, loan portfolio and cash held at other banks) increased from $10.7 billion in Q3 2022 to $14.1 billion in Q4 2022, while Net Interest Margin increased only modestly from 5.86% in Q3 2022 to 5.92% in Q4 2022. As the personal loan origination volumes decline in 2023, the interest-earning assets, and consequently, interest income will grow at a slower pace.
Non-interest income declined sequentially, primarily due to the decline in the income from “loan origination and sales” (from $163.7 million in Q3 2022 to $139.6 million in Q4 2022). In Q3 2022, “loan origination and sales” income was driven by the income from hedging activities (interest rate swaps), while in Q4 2022 it was driven by income from loan sale execution and fair value adjustments (only $200 million in loans were sold in Q4 2022, hence, stressing the impact of fair value adjustments). Thus, income from loan sale execution and fair value adjustments increased from $88.0 million in Q3 2022 to $164.7 million in Q4 2022, while income from derivative hedges declined from $106.2 million in Q3 2022 to $18.5 million.
Let’s focus briefly on segments. Income from the Technology segment has been flat throughout 2022 (the increase from Q1 2022 to Q2 2022 was the result of the Technisys acquisition) and given the profile of Galileo and Technisys customers (other Fintech companies), we should not expect rapid (or any?) growth in 2023. The company is pursuing more mature customers, but this change in strategy will take a long time to translate into revenue. Revenue growth in the Financial Services segment is purely the result of internal pricing of deposits (The Lending segment “pays” the Financial Services segment for deposits). Non-interest income from this segment was also almost flat ($20.2 million in Q4 2021 vs. $19.2 million in Q4 2022).
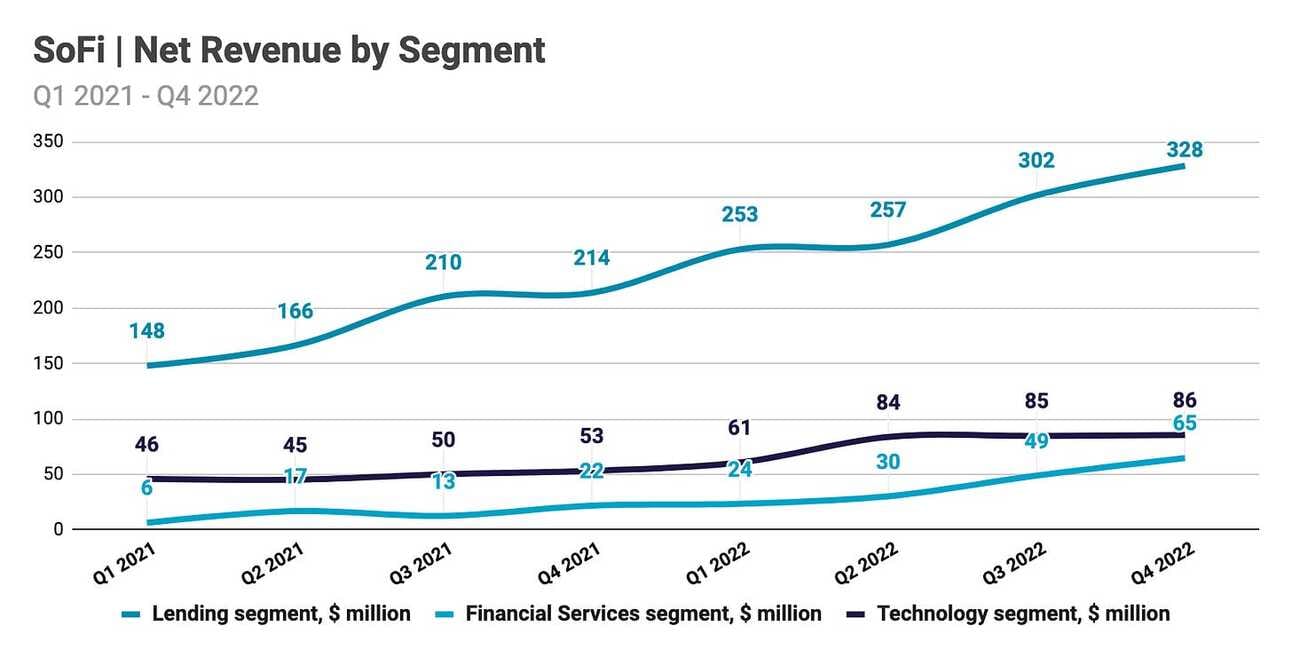
In summary, SoFi used both deposits and other sources of funding to rapidly grow its loan portfolio in 2022. This strategy helped fuel revenue growth in late 2022 and will continue fueling it in 2023 despite declining non-interest income. I estimate a Net Interest Income of $238-240 million (a 151-153% growth compared to Q1 2022) and a Non-Interest Income of $203-214 million (a 9-14% decline compared to Q1 2022) in Q1 2023, which translates into total Net Revenue of $442-455 million (slightly above the company’s guidance). My key assumptions are $2.0-2.25 billion in loan originations, the same Net Interest Margin as in Q4 2022, and flat non-interest income from the Technology and Financial Services segments.
Operating Expenses
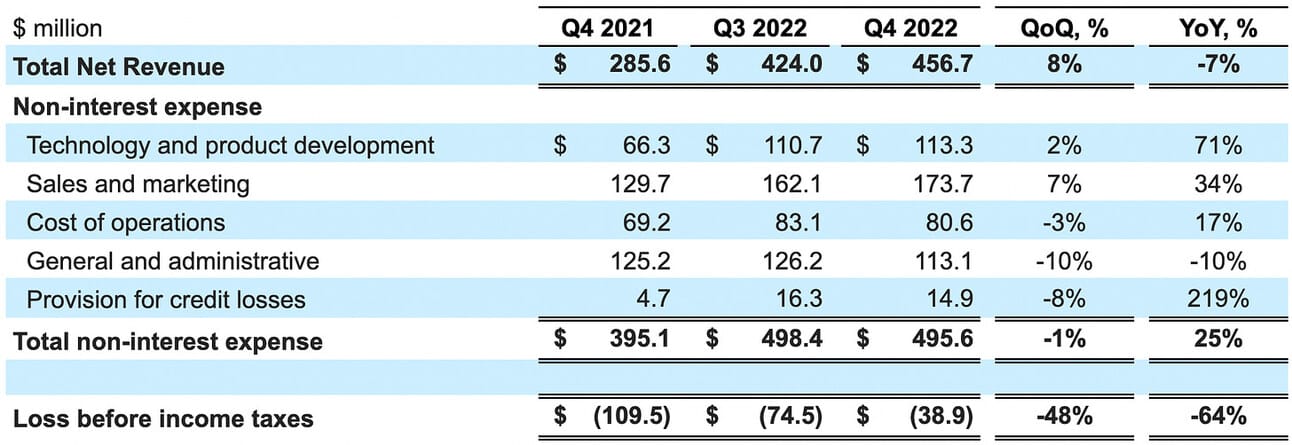
SoFi reported $495.6 million in non-interest expenses, representing a 25.5% increase compared to Q4 2021, and a minor 0.6% decline compared to Q3 2022. The largest cost component, “Sales and marketing” increased 33.9% YoY and 7.1% QoQ to $173.7 million, “Technology and product development” expenses increased 70.8% YoY and 2.3% QoQ to $113.3 million, and “G&A” expenses declined 9.6% YoY and 10.4% QoQ to $113.1 million. SoFi classifies most of the loans that it holds on its balance sheet as “held for sale”; thus, it reports those at fair value and does not have to book provisions for credit losses.
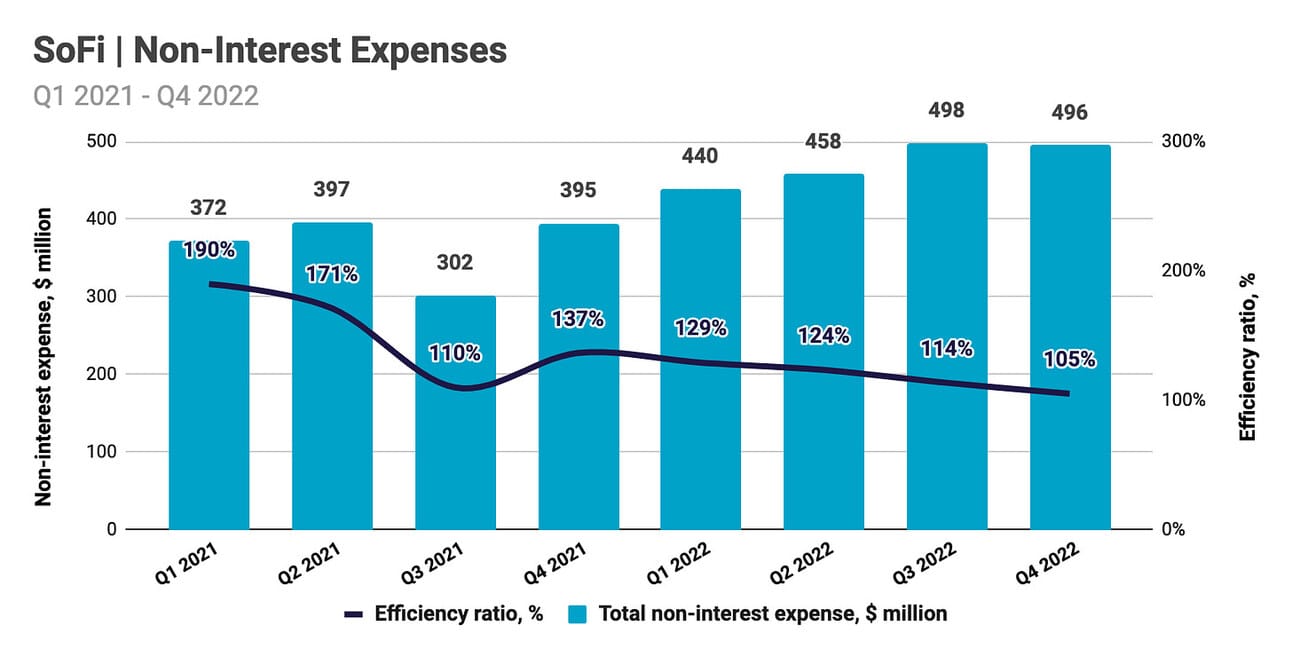
SoFi is still far away from its expected efficiency ratio (non-interest expenses excluding provisions for credit losses divided by net revenue). Thus, the efficiency ratio was 105.3% in Q4 2022, which was an improvement from 136.7% in Q4 2021, but is still considerably higher than the efficiency ratios reported by other banks. Thus, as per FDIC data, the average efficiency ratio for the U.S. banking industry was 57.7% in Q4 2022, and consumer lenders reported an even lower average efficiency ratio of 46.8%. SoFi would need to more than double revenue while keeping the costs fixed to get to the industry average, which is unlikely. Thus, it will take several years for the company to reach its target cost efficiency.
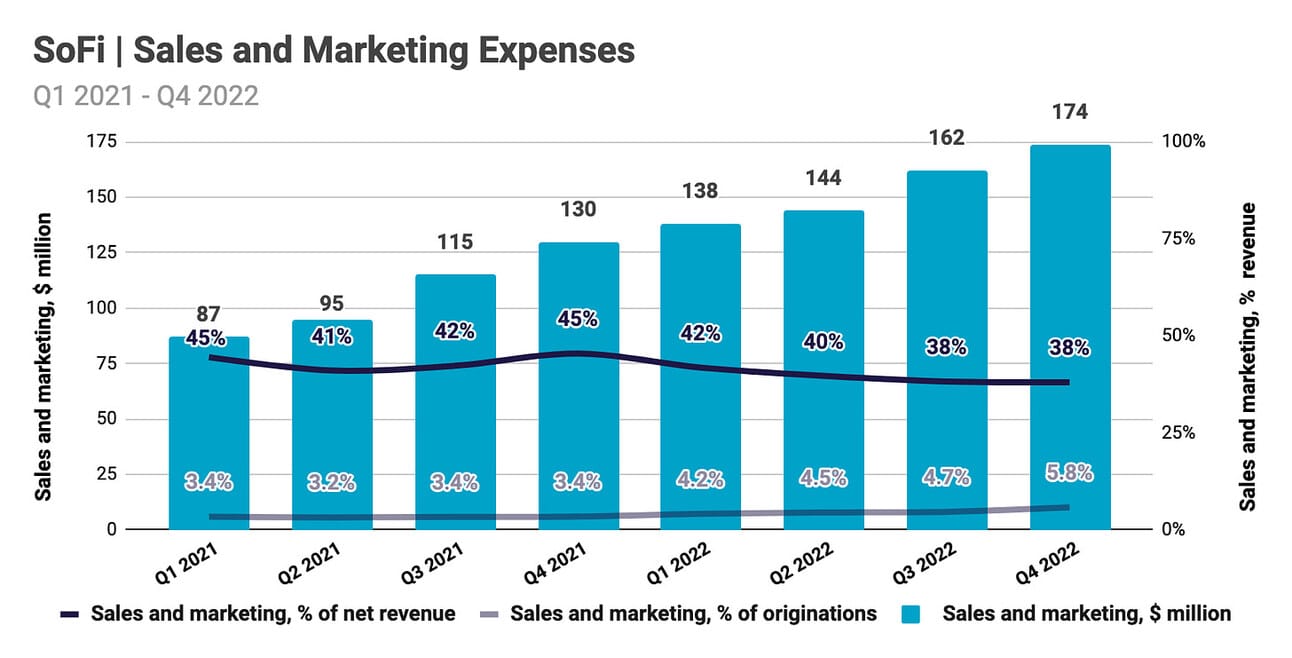
Typically, I would look at the marketing expense divided by the origination volume, in order to understand the marketing efficiency of a consumer lender. However, in addition to marketing its lending products, SoFi spends (or invests) marketing dollars into member and deposit growth, and has two enterprise businesses (Galileo and Technisys) that also require investment. Thus, SoFi spent 38.0% of net revenue on sales and marketing expenses in Q4 2022, compared to 45.4% in Q4 2021. However, in the longer term, I would still expect sales and marketing expenses to represent less than 3% of the company’s originations (compared to 5.8% in Q4 2022).
SoFi has previously communicated its “longer-term goal of single-digit share-based compensation margins”; however, the company has not provided a timeframe for reaching this goal. SoFi spent $71.0, or 15.5% of net revenue, in share-based compensation in Q4 2022, compared to $76.7 million, or 26.9% of net revenue in Q4 2021. Approximately 86% of share-based compensation (in Q4 2022 and for the full year 2022) was allocated to “Technology and product development”, as well as “General and administrative” expense categories. Share-based compensation is the largest adjustment that the company makes in calculating its Adjusted EBITDA.
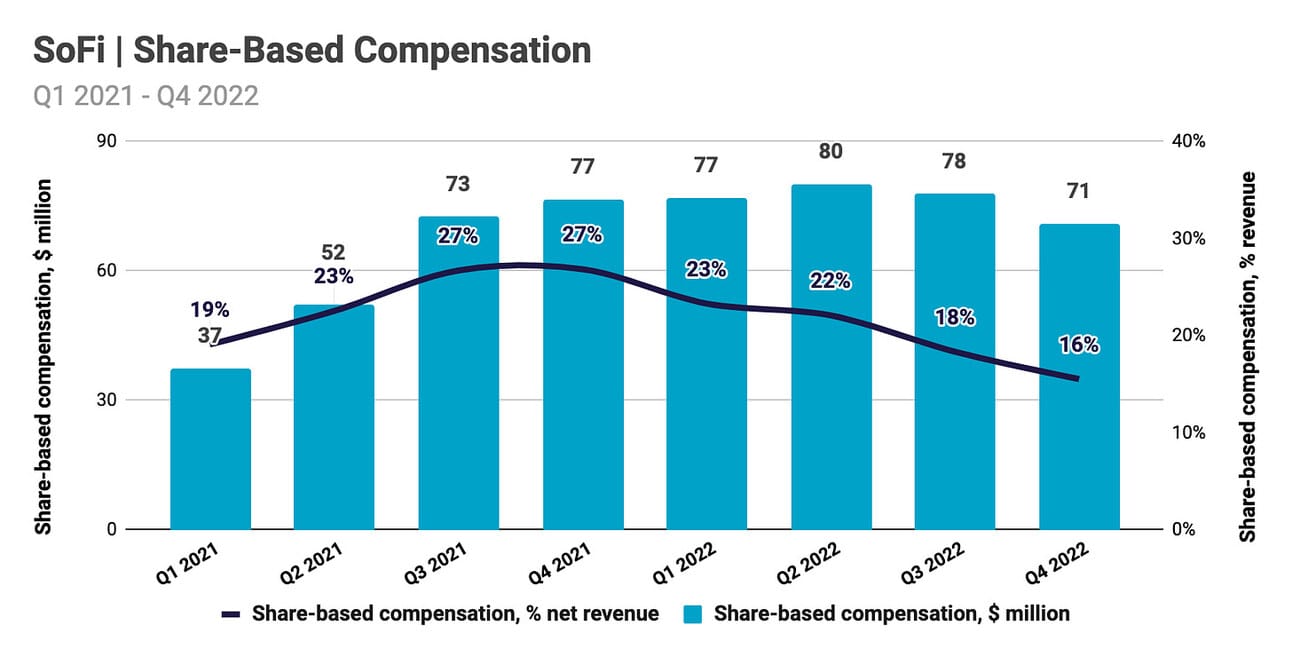
In summary, SoFi is not the most cost-efficient lender out there. The efficiency ratio, sales and marketing expenses (as % of loan origination), as well as share-based compensation (as % of revenue), all suggest that the company has a lot of room for improvement. Some of the imbalances will resolve with scale (higher revenue), some will resolve with maturity (lower investment into growth), but some are a reflection of management decisions (share-based compensation). I estimate $495-500 million in non-interest expenses in Q1 2023 (with marketing expenses being the biggest unknown in my forecast), which would represent flat growth compared to Q4 2022.
Net Income and Adjusted EBITDA
SoFi reported a Net loss of $40.0 million in Q4 2022, compared to a Net loss of $111.0 million in Q4 2021 and $74.2 million in Q3 2022. On an adjusted basis, the company reported an Adjusted EBITDA of $70.1 million, compared to an Adjusted EBITDA of $4.6 million in Q4 2021 and $44.3 million in Q3 2022. The key adjustments in calculating Adjusted EBITDA were share-based compensation, depreciation and amortization (incl. amortization of Galileo and Technisys acquisitions, and SoFi Stadium signage rights), as well as changes in the value of servicing rights.
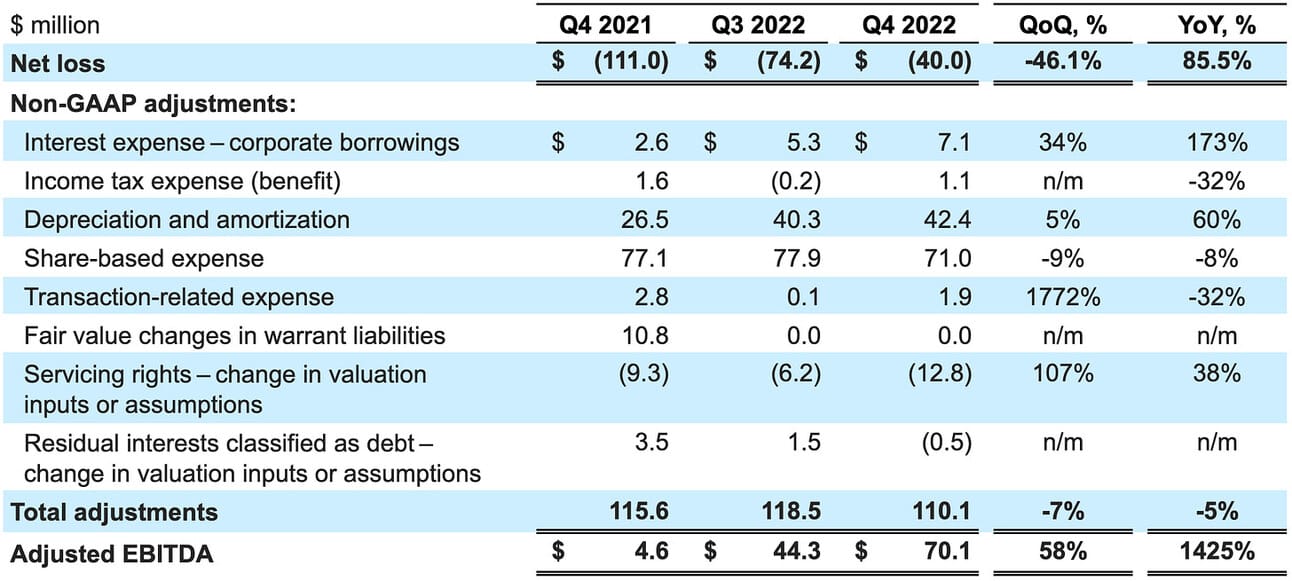
The company’s management guided for an Adjusted EBITDA of $40-45 million in Q1 2023, which represents a 9-10% increase compared to Q1 2022, and an Adjusted EBITDA of $260-280 million, which represents a 14% increase compared to 2022. The company aims to become GAAP-profitable in Q4 2023.
My estimates of $442-455 million in net revenue and $495-500 million in non-interest expenses would translate into a GAAP Net Loss of $47-55 million and an Adjusted EBITDA of $53-61 million in Q1 2023 (assuming that the company will continue to gradually scale back on its share-based compensation to $65 million). Sales and marketing expenses, as well as share-based compensation, are the two weakest assumptions in my calculations, but the overall conclusion is that SoFi’s management gave conservative guidance for the next quarter.
However, when it comes to the annual guidance, it is clear that the company needs to student loan repayment moratorium to end, as assumed, in the middle of the year. As discussed above, personal loan originations will face strong headwinds in 2023, which, when coupled with muted Net Interest Margin expansion, will translate into slower revenue growth in 2023. We should also not expect a material contribution to growth from the Technology segment due to the company’s focus on Fintech clients. Last year, SoFi revised its annual guidance after the moratorium was extended. I think SoFi investors should be prepared for a similar outcome this year.
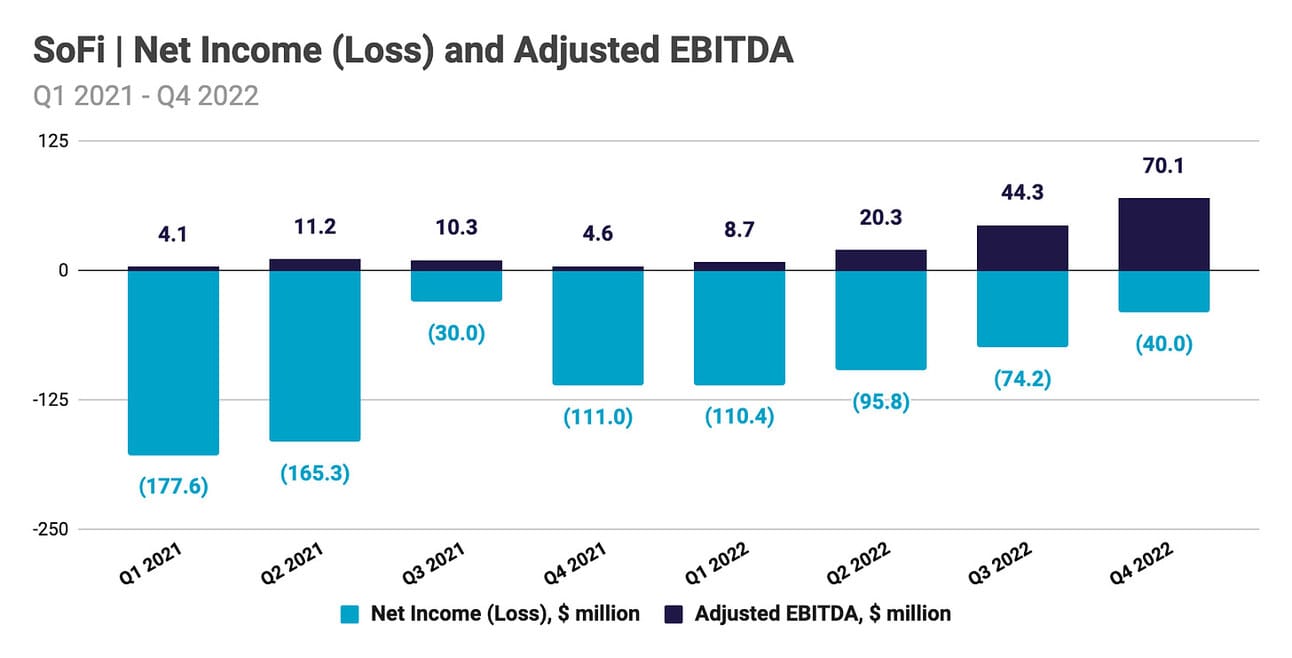
I would also argue that the company’s ability to reach GAAP profitability in Q4 2023 depends on the student loan moratorium finally expiring in 2023. That’s why I put the question mark in the title, question if this will indeed be the final year of SoFi focusing on Adjusted EBITDA profitability, instead of GAAP Net Income.
Things to Watch in 2023
Loan originations. As discussed above, I expect personal loan originations to face strong headwinds in 2023 due to economic uncertainty and the deteriorating creditworthiness of consumers. We have seen other consumer lenders putting on the breaks through tighter credit policies, and I would expect SoFi to follow. Strong deposit inflows and the availability of alternative sources of capital allow the company to buy loan portfolios, as they did in 2022; however, those would be one-off transactions, rather than a regular course of business.
Student loan moratorium. The loan forgiveness program proposed by the Biden-Harris Administration is being challenged in the courts, which might result in further extension of the student loan repayment moratorium (the President might choose to extend the moratorium in case of a negative court ruling). My calculations suggest that SoFi will need to revise its annual guidance should the moratorium be extended again. I would also argue that the company’s ability to reach GAAP profitability this year depends on the moratorium finally ending.
Share-based compensation. The company reiterated the “longer-term goal of single-digit share-based compensation margins”; however, there is little detail on how quickly this could happen. In Q4 2022, share-based compensation of $71.0 million just slightly exceeded the Adjusted EBITDA of $70.1 million, which means that the company is approaching positive EBITDA on a non-adjusted basis (at least not adjusted with share-based compensation). Any further cuts to the share-based compensation would help the company reach that point faster.
GAAP profitability. SoFi has been in business for more than a decade, it went public in 2021 and became a bank holding company in 2022 after completing the acquisition of Golden Pacific Bank. I believe it is time for SoFi to reach GAAP profitability and stop messing around with Adjusted EBITDA. This is just not what banks do. There are headwinds and the company’s ambition to reach GAAP profitability in Q4 2023 might be derailed by another extension of the student loan repayment moratorium, but this is definitely something to look forward to!
Source of the data used above: Investor Relations
Disclosure & Disclaimer: I own shares in several companies that I write about in this newsletter, as I am bullish on the transformation in the financial services industry. However, the information contained in this newsletter is intended for informational purposes only and should not be considered financial advice. You should do your own research or seek professional advice before making any investment decisions.