
Those of you who read my letter “Top Brazilian Fintech companies trading on US stock exchanges”, would know about my fascination with Brazilian Fintech companies. Brazil is the home of Nubank, Banco Inter, Stone, PagSeguro…and XP Investimentos (NASDAQ: ), a modern brokerage that successfully competes with incumbent players.
While writing this profile, I was contemplating titling it “a blueprint for building a modern brokerage” because I strongly believe there is so much to learn from XP. During the 2018-2021 period, the company’s client base, Assets Under Custody, and revenue grew at a Compound Annual Growth Rate of over 50%…and the company has consistently delivered a 25%+ Net Income and a 35%+ Adjusted EBITDA margin. Somehow, XP figured out the magic sauce for delivering impressive growth while maintaining consistent profitability.
Without further ado…let me introduce you to XP Investimentos!
Please note that the company reports in Brazilian Reals (denoted in the text below as R$), and as of this writing, the exchange rate to USD was R$5.26.
Business Overview
In their own words, “XP is a leading, technology-driven platform and a trusted provider of low-fee financial products and services in Brazil.” At its core, the company is a brokerage providing over 3.5 million individuals, small and medium-sized businesses, and corporations with access to financial instruments via its three brands: XP Investimentos, Clear, and RICO. XP’s customers can trade over 800 financial instruments, including securities, fixed-income instruments, mutual funds, and real estate investment trusts (REITs).

In addition to supporting self-directed investing via the web and mobile apps (“XP Direct”), the company provides private banking services to high-net-worth individuals and family offices (“XP Private”), as well as trading desks and securities and debt placement services for its corporate clients. The company also operates a network of Independent Financial Advisors (IFAs), as well as multiple financial media and educational properties. The company reports its results under four segments: “Retail”, “Institutional”, “Issuer services” and “Digital Content”.
XP continues actively investing in expanding and improving its core business. Thus, in 2022 the company started offering its clients access to the U.S. stock market (“XP International”) and foreign currency exchange, as well as Bitcoin and Ether trading (“XTAGE”). As you will see later in the text, the company is highly profitable and has the capacity to invest in new products and services.
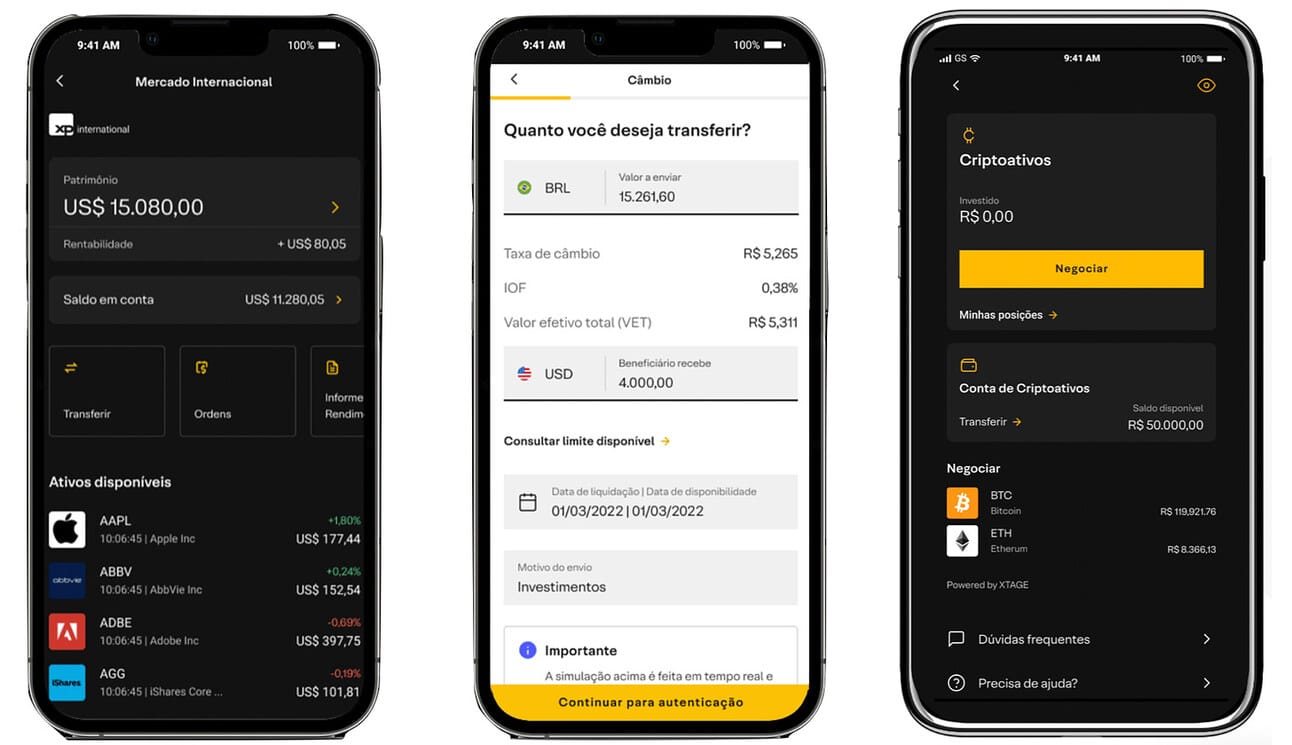
XP is also actively diversifying its product range and revenue stream. Thus, the company started offering digital banking accounts, credit cards, collateralized personal loans, pension plans, and insurance. These initiatives, referred to as “New Verticals”, contribute just over 7% of the company’s revenues, but exhibit triple-digit growth. The company doesn’t limit itself to reselling products from other companies, and besides acting as a broker, does underwrite loans, manages pension plans, and underwrites insurance policies.

Finally, at the beginning of 2022, the company agreed to acquire Banco Modal, one of its competitors serving approximately 500,000 customers. The acquisition is expected to close by the end of the year and is subject to regulatory approvals.
Active Clients
XP reported 3.6 million clients at the end of Q2 2022, and although the growth slowed in the last 12 months, the long-term trend is nothing short of impressive. Thus, the company’s client base grew at the Compound Annual Growth Rate (CAGR) of 56% during the 2018 - 2021 period.

For comparison, at the end of 2021, Banco Inter and Nubank, the company’s closest competitors (outside of traditional banks), reported 2.0 million and 6.3 million clients using their investment products. As a reminder, Nubank completed the acquisition of Easyinvest in June, 2021, and rebranded it into NuInvest.
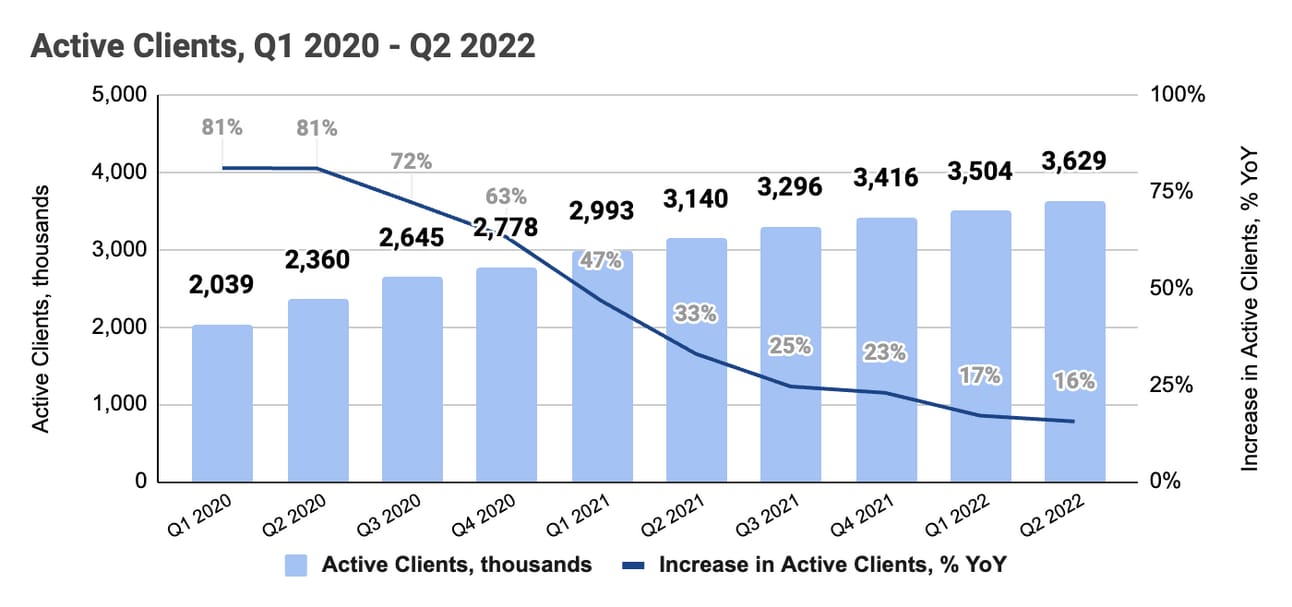
XP defines an “active client” as an individual, a small and medium-sized enterprise, or a corporation that either had AUC above R$100 or has transacted at least once in the last thirty days. The metric includes clients served by XP, Rico, Clear, and XP Investments brands.
Assets Under Custody
The company reported R$ 846.2 billion in Retail Assets Under Custody (AUC) at the end of the quarter. Retail Assets Under Custody grew at the compound rate of 59% from 2018 to 2021. For comparison, at the end of 2021, Banco Inter and Nubank reported AUC of R$52 billion and $33 billion respectively.

Assets Under Custody is the function of a) net customer inflows (deposits less withdrawals), and b) fluctuation in the market value of customer assets. XP customers continued depositing funds throughout every quarter of 2020 - 2022; thus, the quarterly declines in the AUC (i.e. in Q3 2021 and Q2 2022) are primarily the result of the decline in the prices of the customer assets.
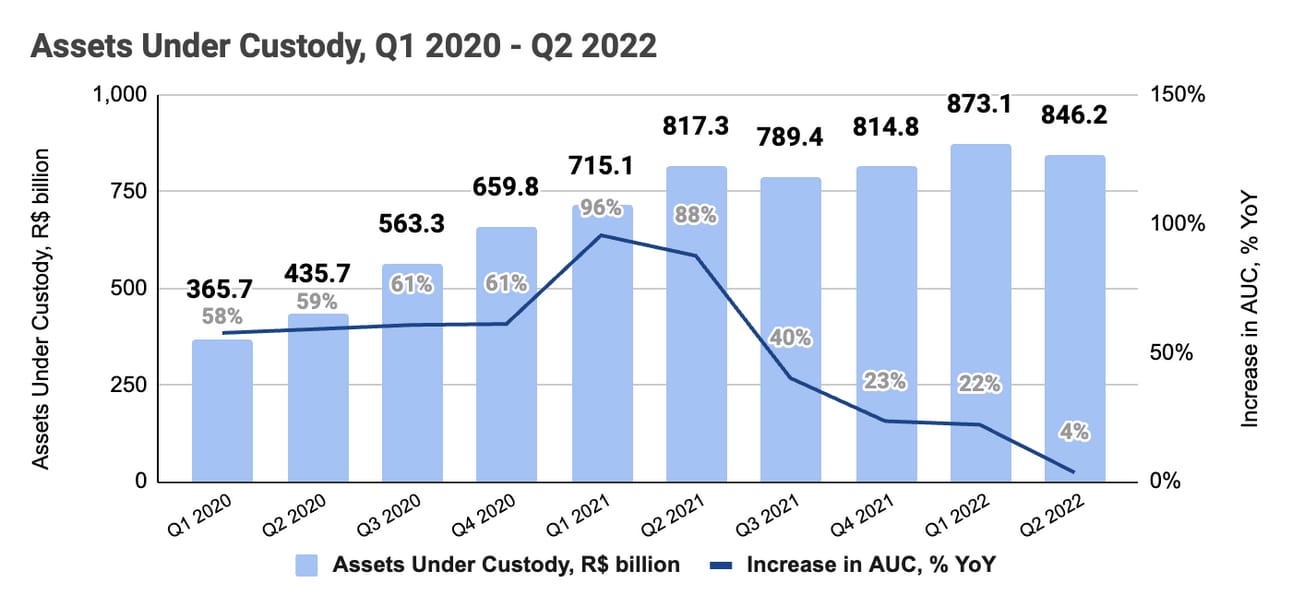
XP defines Retail AUC as “the market value of all retail client assets invested through XP’s platform, including equities, fixed income securities, mutual, hedge and private equity funds, pension funds, exchanged traded funds, COEs (Structured Notes), REITs (real estate investment funds), and uninvested cash balances (Floating Balances).”
Customer Activity
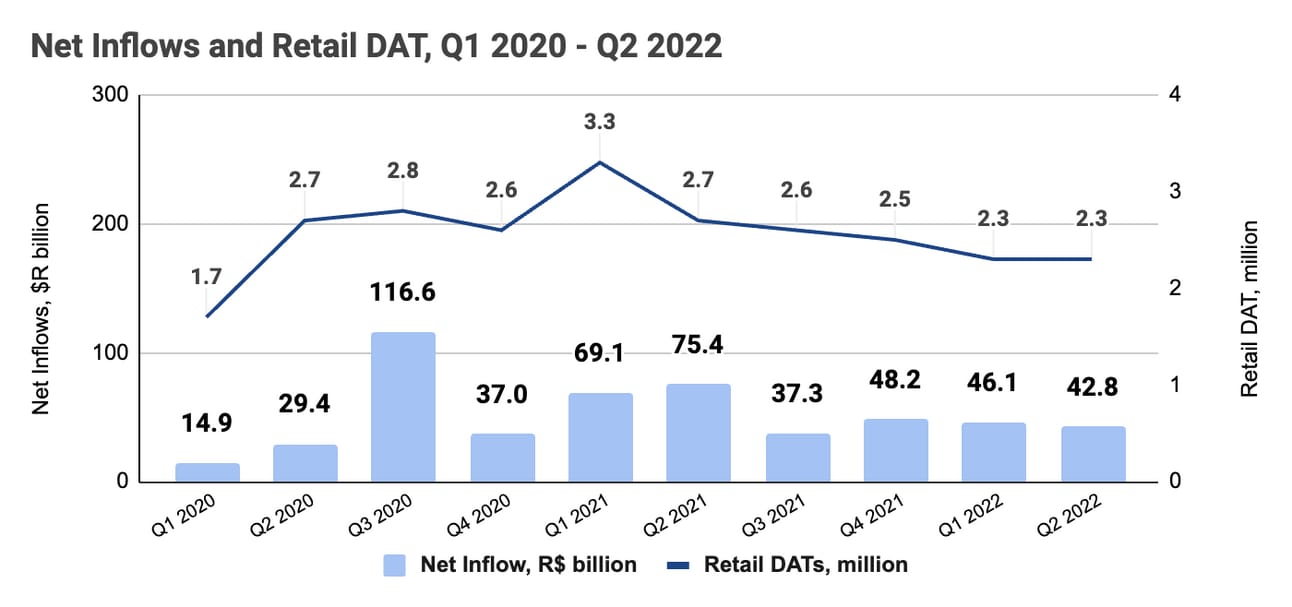
XP reports two metrics that help investors understand customer activity: Retail Daily Average Trades (DATs) and Net Inflows. As can be seen from the table below, the company enjoyed positive and increasing net inflows during 2018 - 2021, with customers depositing $R174.4 million over the last 12 months despite the market volatility. The current run rate suggests that net inflows in 2022 will be lower than in 2021, as the net inflows stabilized at R$40+ million per quarter.

In terms of the Daily Average Trades (DATs), you can see declining customer activity on the chart below. The company is diversifying its revenue sources (i.e. by launching non-investment products, such as credit cards); however, trading revenue remains at the core of the company’s income; thus, DATs are a critical metric to monitor. The company did not report DATs before 2021, so the DATs of 1.7 million that the company reported in Q1 2020 is the only “pre-pandemic” level that we have.
Revenue
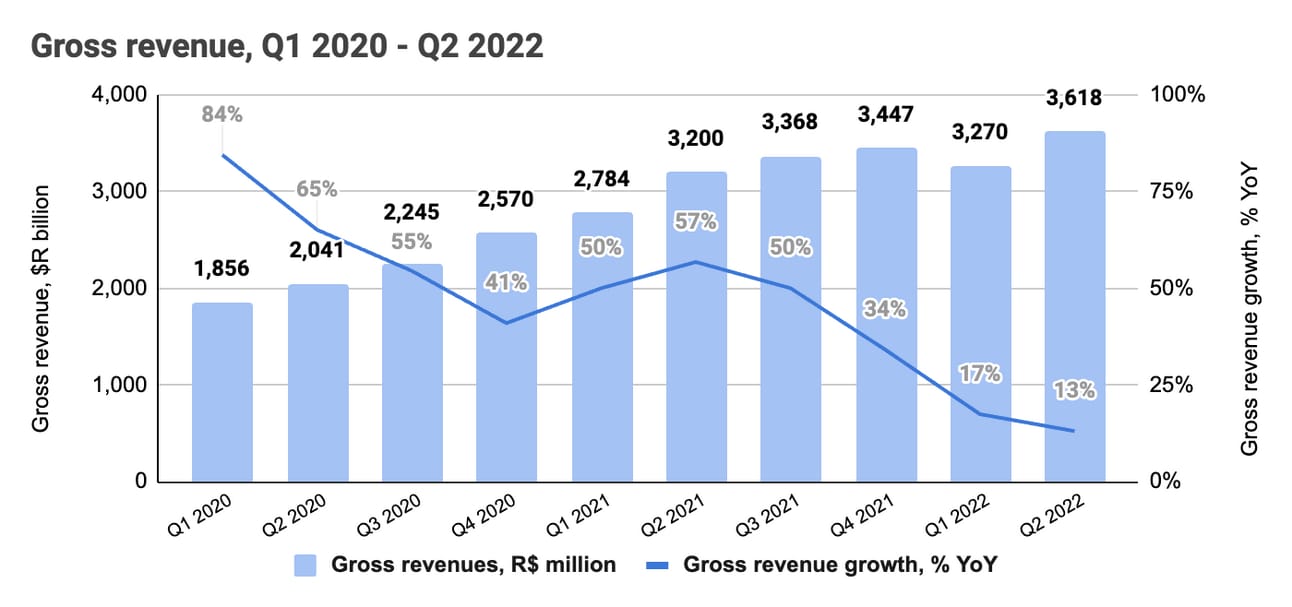
The company generated R$13.7 billion in gross revenue during the last 12 months (Q3 2021 - Q2 2022 or “TTM” in the table below). Gross revenue includes taxes, so net revenue is a better measure of the company's income. However, the company reports segment and vertical performance only on gross revenue level, so we have to live with it.

The company delivered a compound annual gross revenue growth rate of 58% during the 2018 - 2021 period. As can be seen from the chart below, the gross revenue growth rate decelerated in 2022, which is expected given the market turbulence. The company continues to grow even in this environment, which is notable.
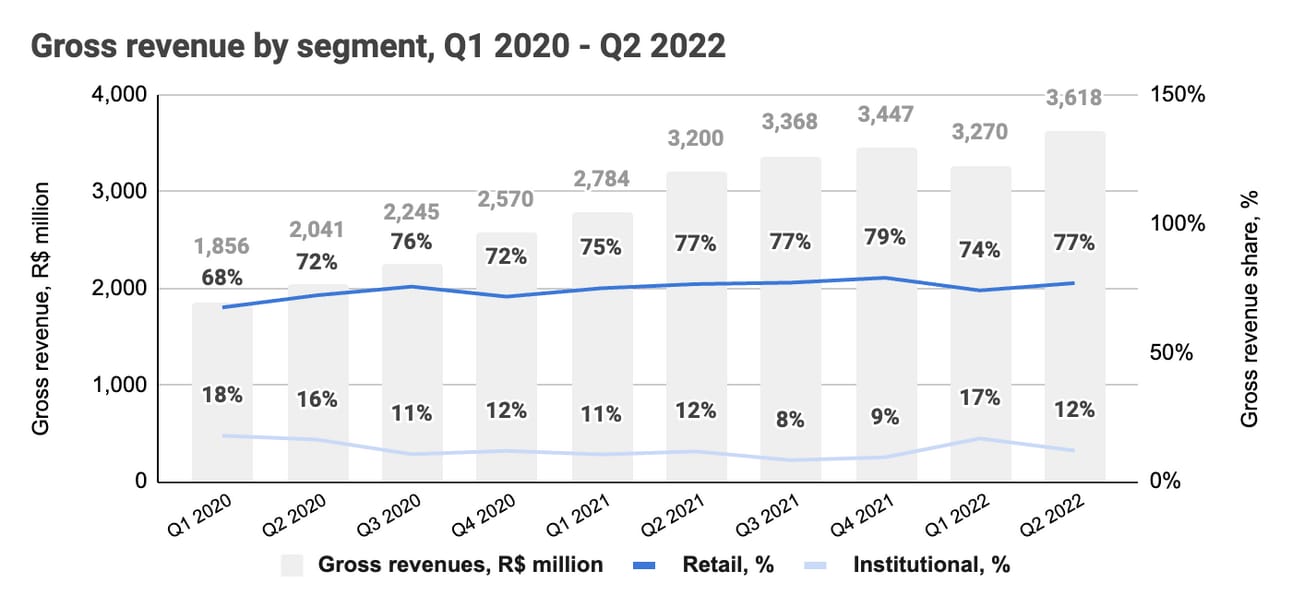
The company reports revenue in four segments: a) retail, b) institutional, c) issuer services, and d) digital content. As the chart below illustrates, retail is by far the largest segment in terms of gross revenue, and has consistently contributed over 70% of the revenue. Excluding the one-off spike in Q1 2022, the institutional segment contributed 11-12% to the company’s gross revenue.
As mentioned above, the company is making a strong push toward non-investment products (digital accounts, credit cards, retirement plans, insurance), and these new verticals started making meaningful revenue contributions. Thus, the gross revenue from the new vertical surpassed 7% of the total gross revenue in 2022 (despite the continued growth in the company’s core business). The credit card business contributed 3.2%, and retirement plans contributed 2.2%, credit contributed 1.2% and insurance contributed 0.6% to the Q2 2022 gross revenue.

Net revenue (gross revenue excluding taxes) experienced a quarterly decline only once in the last two and a half years (Q2 2022), and grew at a compound annual rate of 60% over the 2018 - 2021 period. Net revenue growth decelerated in 2022, but nevertheless continued growing driven by both core and non-core (new verticals) businesses. Thus, while Q2 2022 revenue from the core business grew 9% YoY, the revenue from the new verticals grew 115% YoY.

Operating Expenses
XP reported R$9.23 billion in operating expenses in the last four quarters, which resulted in Income before income tax of R$3.75 billion. The company’s operational efficiency allowed it to deliver a compound annual operating income growth rate of 83% over the 2018 - 2021 period, as the expenses grew at a slower pace than the revenue.

The company allocates expenses into multiple categories, but the vast majority fall under either “Administrative expenses” or “Operating costs”. As can be seen from the chart below, the operating expenses typically account for 70% of the total net revenue, and “Administrative expenses” and “Operating costs” are the major drivers.
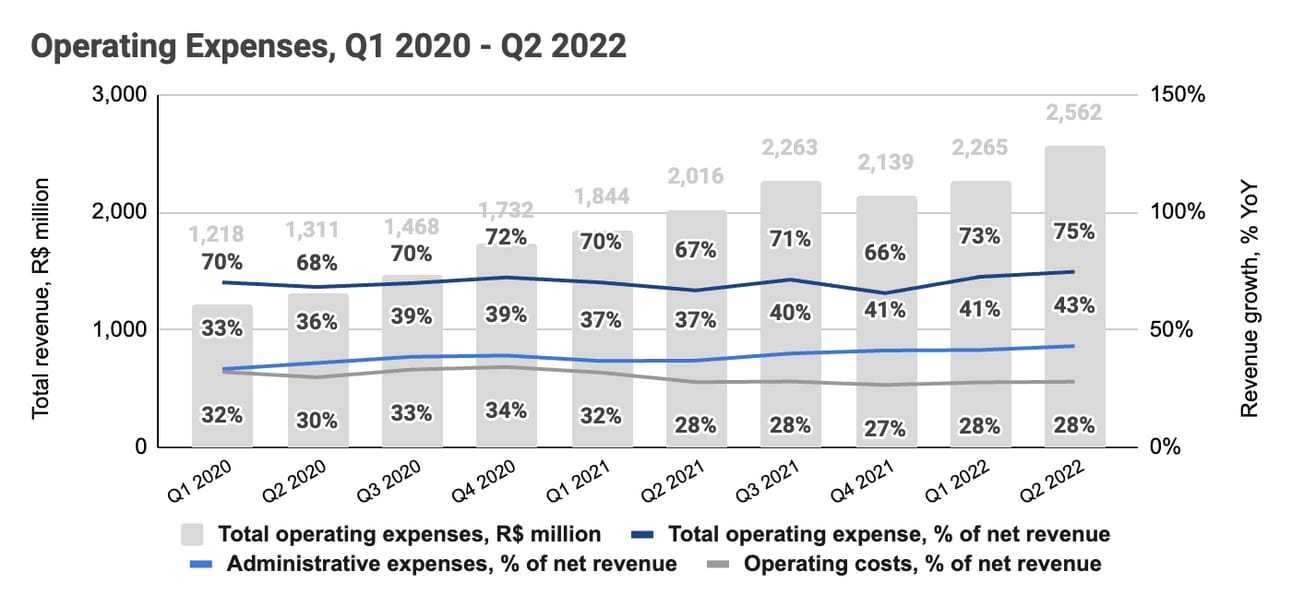
The company is aggressively investing in new investment products, and new verticals, as well as in building a network of Independent Financial Advisers. However, as you can see from the numbers, it can do so without sacrificing profitability.
Net Income and Adjusted EBITDA
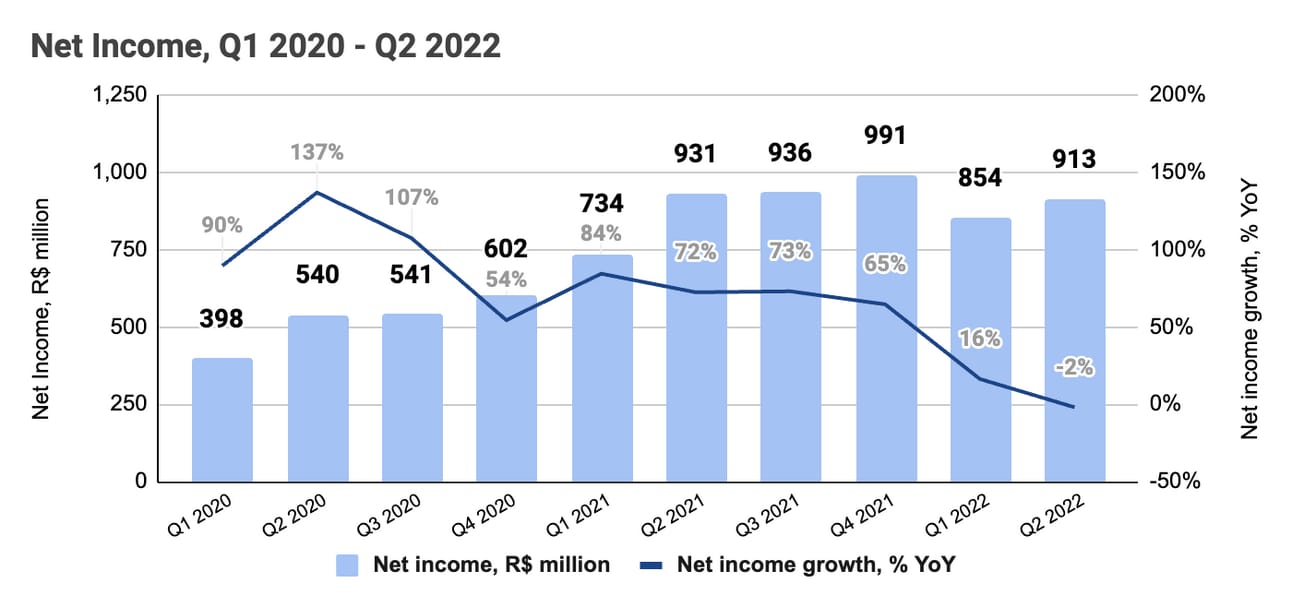
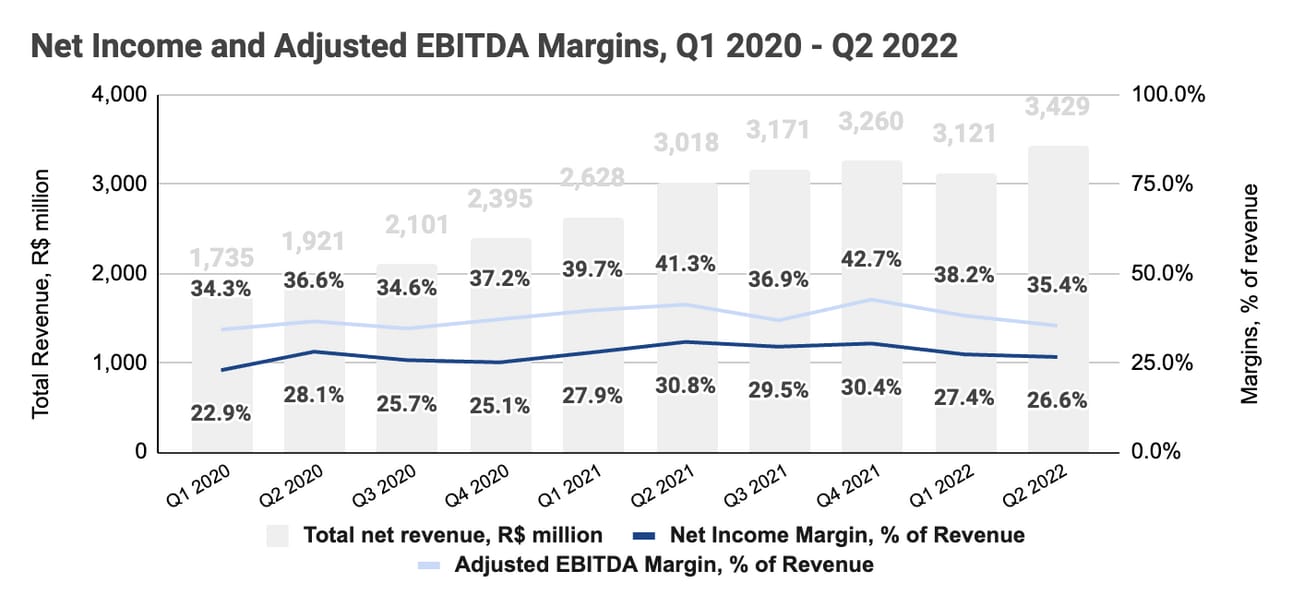
XP reported R$3.69 billion in Net Income and R$4.97 billion in Adjusted EBITDA during the last four quarters. Net income grew at 98% CAGR, and Adjusted EBITDA grew at 10% CAGR during the 2018 - 2021 period.

Net Income growth slowed down in 2022, and the company even posted the first YoY decline in Q2 2022. Nevertheless, seeing a profitable Fintech company is an exception, and XP's profitability and growth rates put it in the category of its own. The company calculates Adjusted EBITDA by deducting share-based compensation from EBITDA reported under IFRS (i.e. the company reported $212 in share-based compensation in Q2 2022).

As can be seen from the chart below, the company has been consistently delivering a Net Income Margin in excess of 25% (of net revenue), and an Adjusted EBITDA margin in excess of 35% (of net revenue). Therefore were better quarters along the line, but 25% and 35% are good ballpark measures of the company’s profitability under IFRS and on an adjusted basis.
Things to Watch in 2022
Trading Volumes. Trading in financial instruments remains the core driver of the company’s revenue, and, despite the market volatility in 2021 and 2022, XP managed to deliver consistent growth. The company constantly expands its offering (U.S. equity trading, crypto), as well as continues to build the network of IFAs. Nevertheless, worsening economic conditions will have an impact on its core segment, retail customers, and their ability to deposit new funds.
Competition. XP faces competition from established players, such as Itaú Unibanco and Bradesco, and other Fintech companies, such as Nubank and Banco Inter. Nubank, the world’s largest neobank boasting over 65 million customers, acquired a competing brokerage, Easynvest, in 2021, as well as launched crypto trading in 2022. So the competition is heating up and it will be interesting to see if XP manages to keep its leading position.
New Verticals. XP got to a strong start in launching new products; however, those still represent a marginal share of the company’s revenue. The company is pursuing multiple opportunities at the same time (lending, insurance, pension), and doesn’t shy to be the “producer” of those services rather than just an agent. Let’s see how quickly the new services rump up, and if the broad pursuit of opportunities does not hurt the company’s performance.
Acquisitions. The company is profitable and can grow inorganically by either acquiring customer portfolios (such as in the case of Banco Modal) or pursuing acquisitions aiming to expand the breadth of its product offering. The slowdown in venture capital funding might result in promising startups finding their home with XP.
In summary, XP is definitely an interesting Fintech company to follow. It somehow magically combines product innovation, growth, and profitability, so there is so much to learn from it. The company reports its results on a quarterly basis and pre-announced KPIs ahead of the earning calls.
Source of the data used above: Investor Relations
Disclosure & Disclaimer: despite rocky performance in 2021 and 2022, I own shares in most of the companies covered in this newsletter, as I am extremely bullish on the long-term transformation in the financial services industry. However, none of the above is or should be considered financial advice, and you should do your own research.