Hey!
Visa reported its Fiscal Q3 2024 results earlier this week. The company’s financial performance is the outcome of consumers and businesses spending money with their Visa cards. The more money is spent with Visa cards, the higher the fees that the company collects from issuers and acquirers.
Thus, it is common to say that Visa’s results provide a good read on the state of the economy and the financial health of consumers. In theory, Visa’s performance should provide an even better read on the performance of payment companies, that typically report later in the earnings season.
There’s certainly truth to that. However, Visa is a beast that operates across many geographies and makes money in many different ways. So this time around, I decided that it’s finally time for me to dig deeper into Visa’s earnings and see if we can learn something.
My conclusion: we can learn a lot, but one needs to know where to look.
Jevgenijs
p.s. if you have feedback just reply to this email or ping me on X/Twitter
Let’s decompose Visa’s revenue, as well as the underlying revenue drivers. Visa makes money in many different ways, so some of the metrics can provide broader insights about the economy, while others are specific to Visa.
In Fiscal Q3 2024 (Visa’s fiscal year starts in October, so its fiscal third quarter is the second quarter of the calendar year), Visa reported net revenue of $8.9 billion, and adjusted net income of $4.9 billion or $2.42 per share. Adjusted net income excludes gains and losses on equity investments, amortization of acquired intangible assets and acquisition costs, litigation provision, as well as a few other one-time costs.
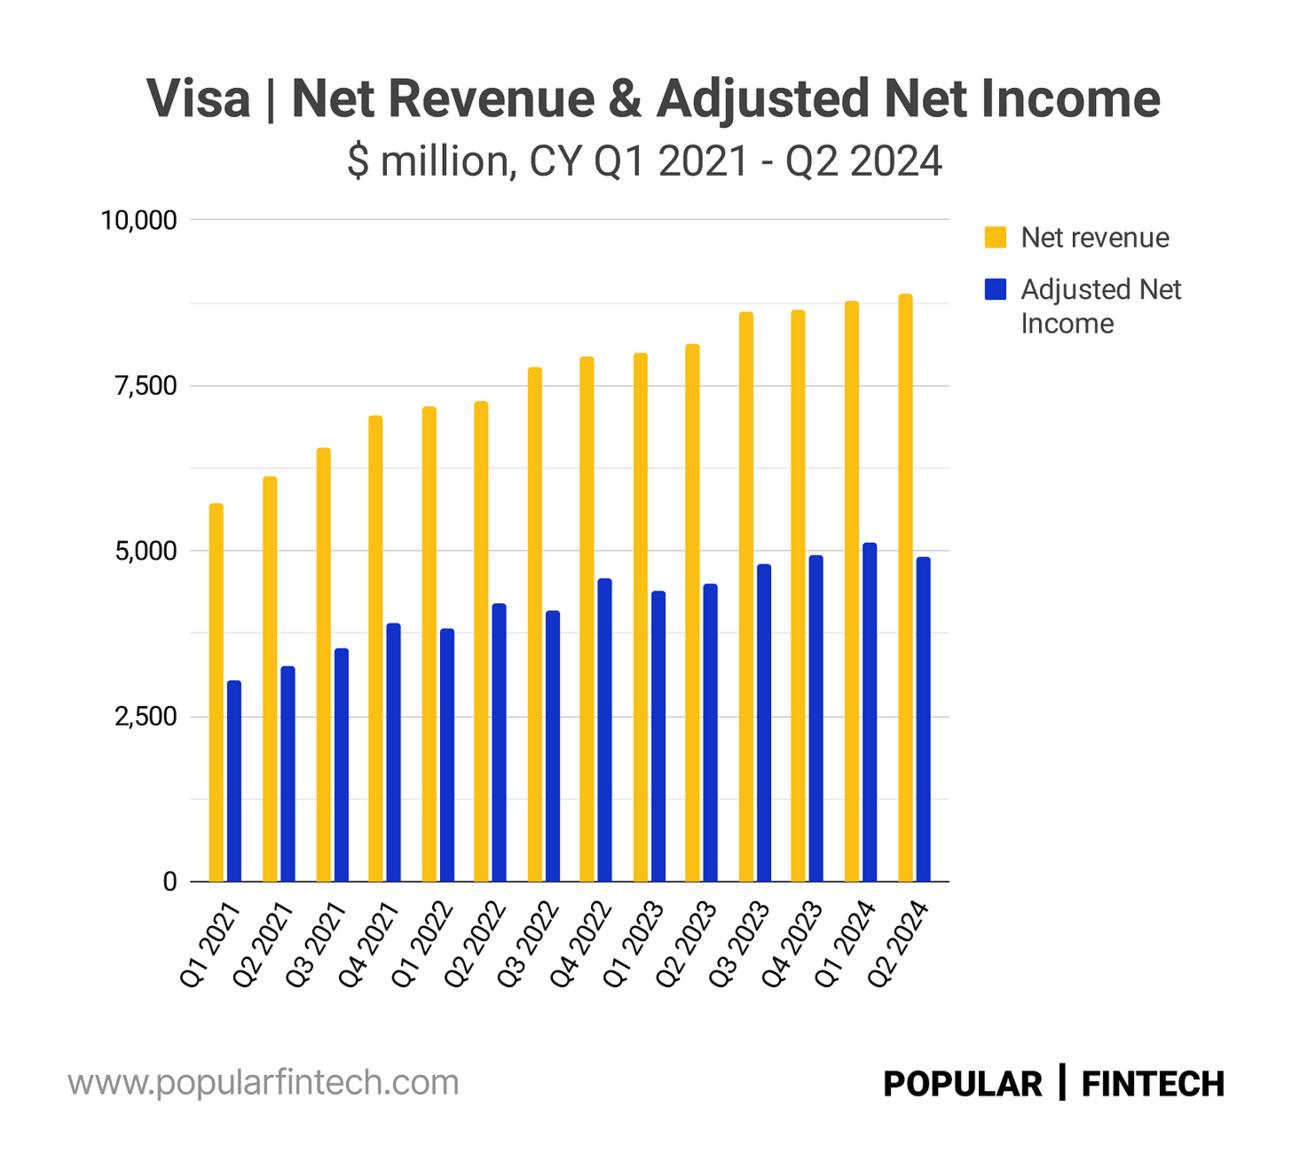
Visa’s net revenue for the quarter increased 9.6% YoY, while adjusted net income grew 9.1% YoY. As you can see from the chart below, revenue is slowing down, but is still in line with the company’s fiscal full-year 2024 guidance of “high single-digit to low double-digit” (please note that I use calendar year quarters in all charts, denoted by “CY”).
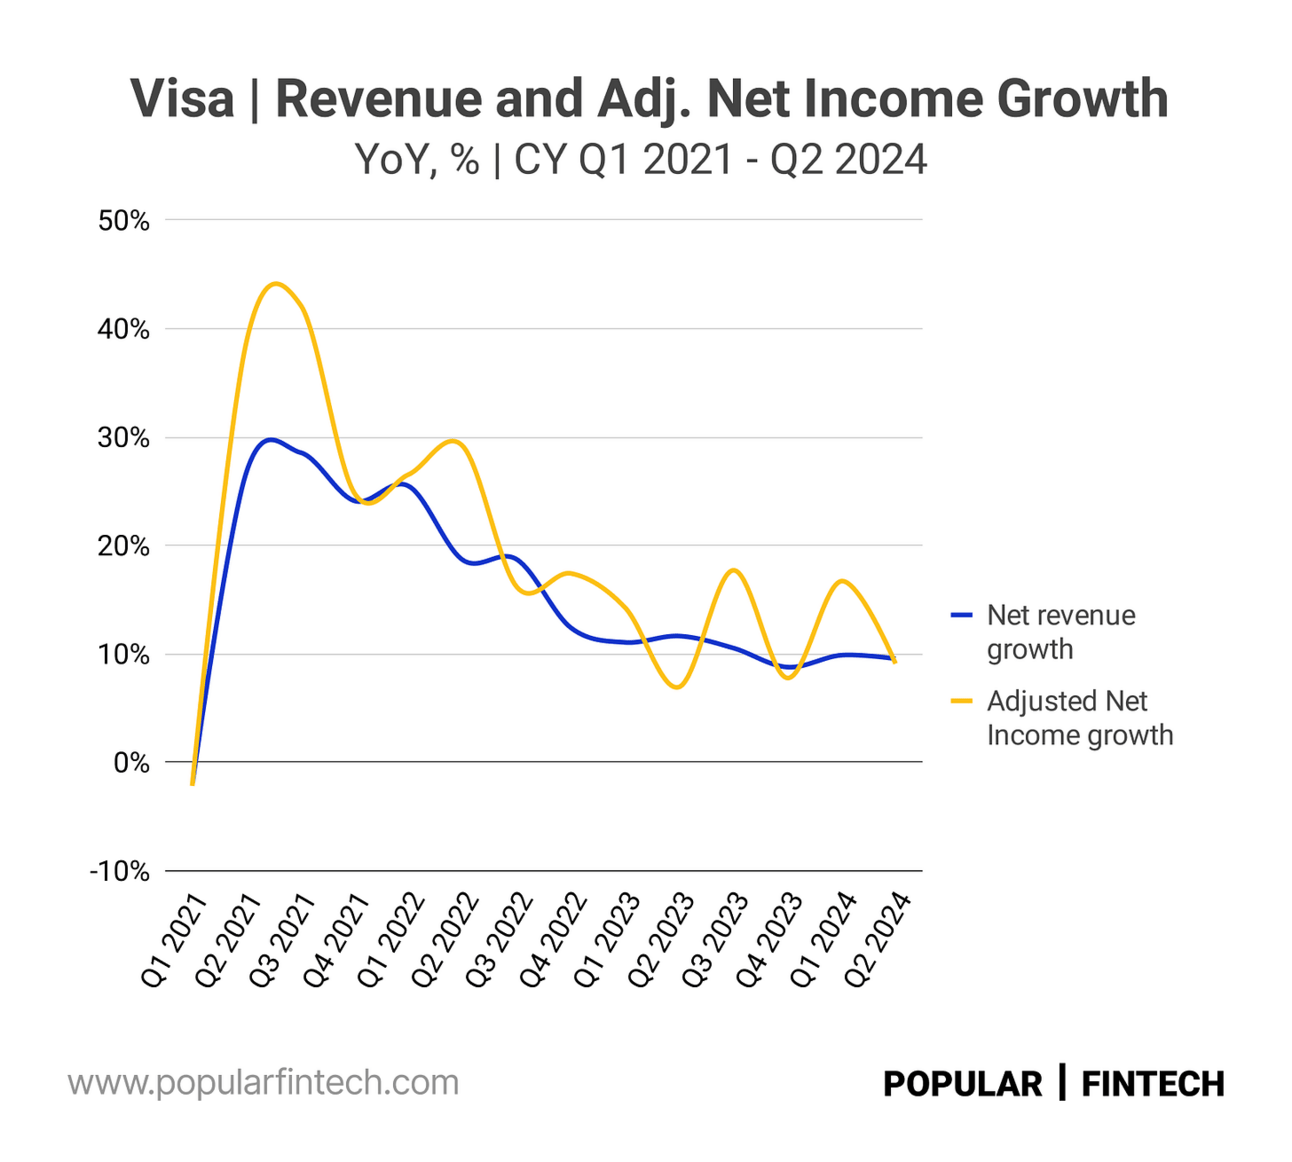
“Net revenue increased over the three month prior-year comparable period primarily due to the growth in nominal cross-border volume, processed transactions and nominal payments volume, partially offset by higher client incentives.”
Visa, Fiscal Q3 2024, Form 10-Q
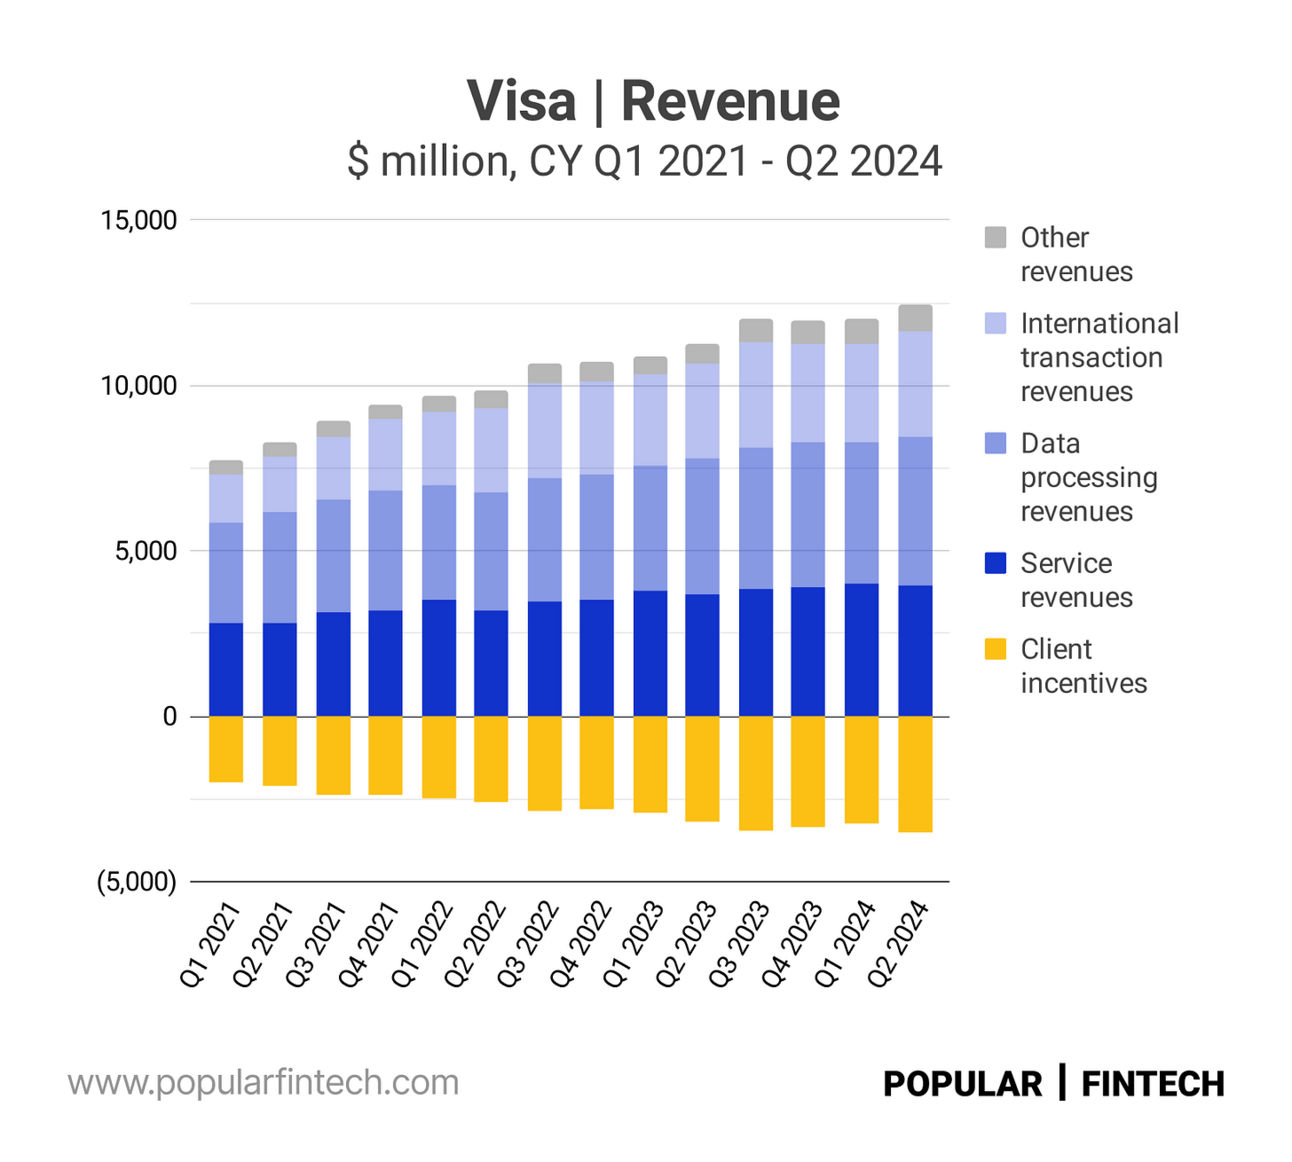
So what comprises Visa’s net revenue? Visa breaks down its revenue into service, data processing, international transaction, and other revenues. Service revenue is driven by the payment volume (dollar amount of purchases with Visa-branded cards), which simply means that Visa collects fees on all payments made with Visa-branded cards.
In case Visa’s network is used to process the payment, the company also earns data processing revenue. Not all payments with Visa cards are processed over Visa’s networks (some payments are processed over different networks, such as Pulse or Star in the U.S.). Thus, the driver for the data processing revenue is the volume of processed transactions.
“Payments volume is the primary driver for our service revenue, and the number of processed transactions is the primary driver for our data processing revenue.
Depending on applicable regulations, some payment processors may or may not use our network to process Visa-branded card transactions. If they use our network, we may earn service revenues and data processing revenues. If they do not use our network, we earn only service revenues.”
Visa, Fiscal 2023, Form 10-K
Visa also earns extra revenue on cross-border transactions (that is when a card is used in another country, or when a card is used online to purchase something from a merchant based in another country). Finally, there are “other revenues”, which are advisory, certification, licensing, and similar fees.
Visa “returns” part of the fees it collects from issuers and acquirers in the form of “incentives”. Upon meeting pre-agreed performance metrics (e.g. transaction growth), issuers and acquirers get part of the fees back (primarily in cash), which serves as a financial incentive (hence the name) to grow volumes on the network. Thus, net revenue means gross fees net of incentives.
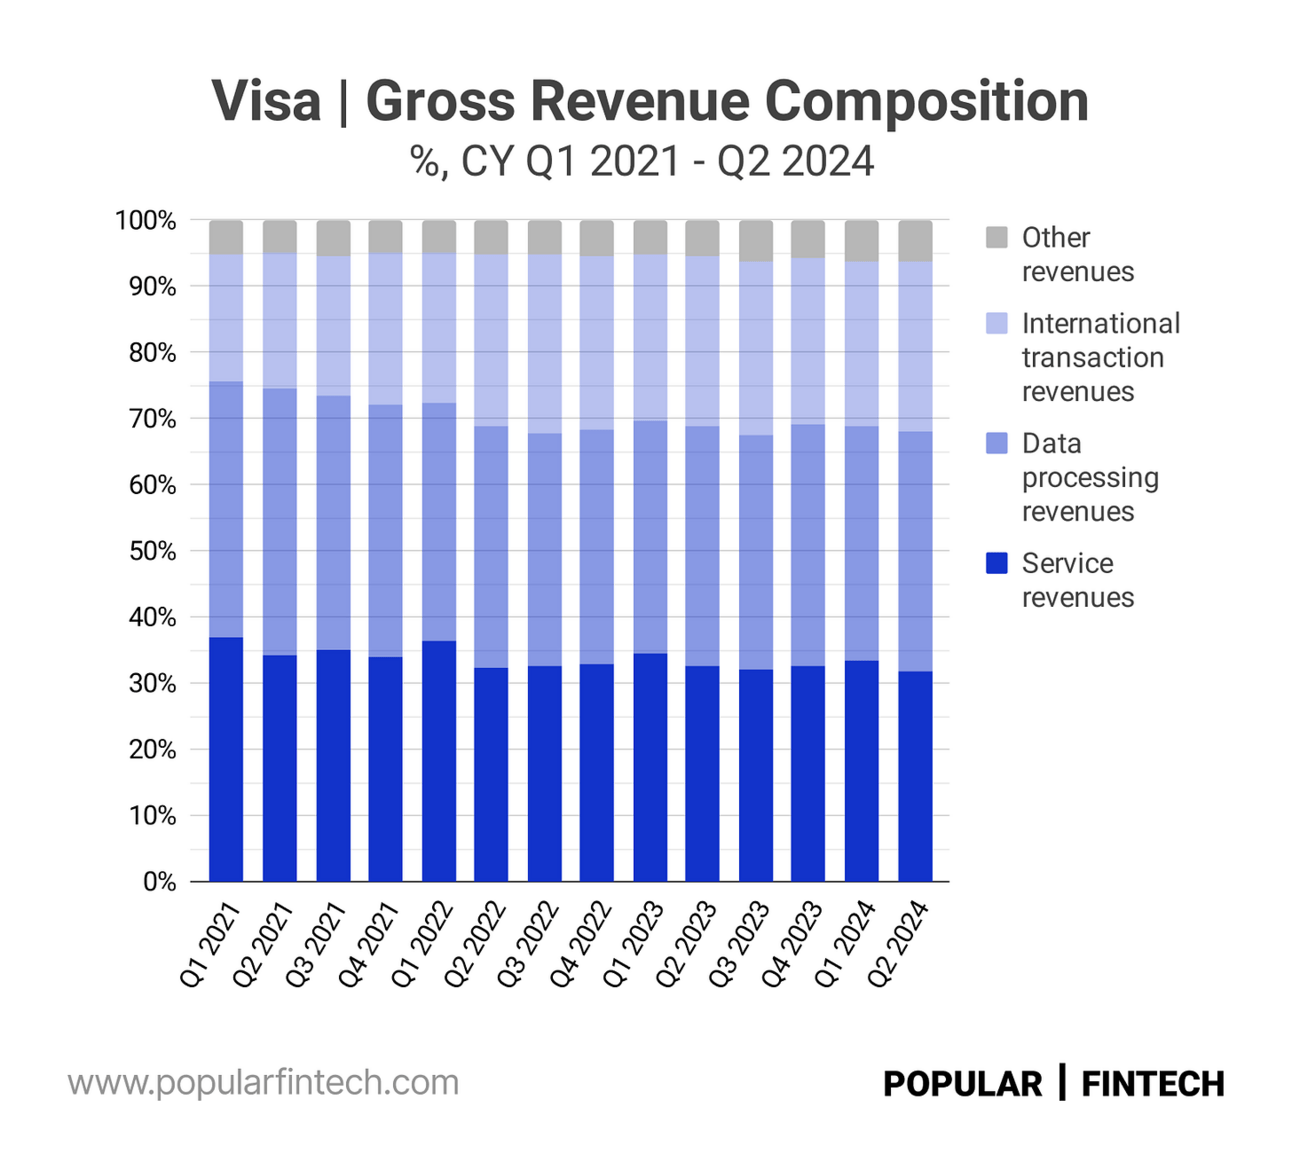
As can be seen from the chart below, Visa’s gross revenue (before paying incentives) is somewhat equally split between service revenues (1/3), data processing revenue (1/3), and international transaction and other revenues (1/3). Please don’t read much into the declining share of service and data processing revenues. This is just a temporary impact of the pandemic.
In Fiscal Q3 2024 (CY Q2 2024), all three major revenue components, including service, data processing, and international transaction revenues increased by less than 10% YoY. However, as you can see from the chart below, growth across the company’s revenue components is not in sync. You can literally see the history of the past few years on this chart, including intensified travel after the pandemic and high inflation last year.

Alright, now let’s get to the drivers of the revenue (reported by Visa as “Operational Performance Data”). In Fiscal Q3 2024, payment volume (the driver of service revenue) increased 5.0% YoY in nominal terms, and 7.4% on an FX-neutral basis. If we exclude 2020, the year disrupted by the pandemic, this was the lowest growth rate since at least 2017, when Visa acquired Visa Europe, forming a single global entity.
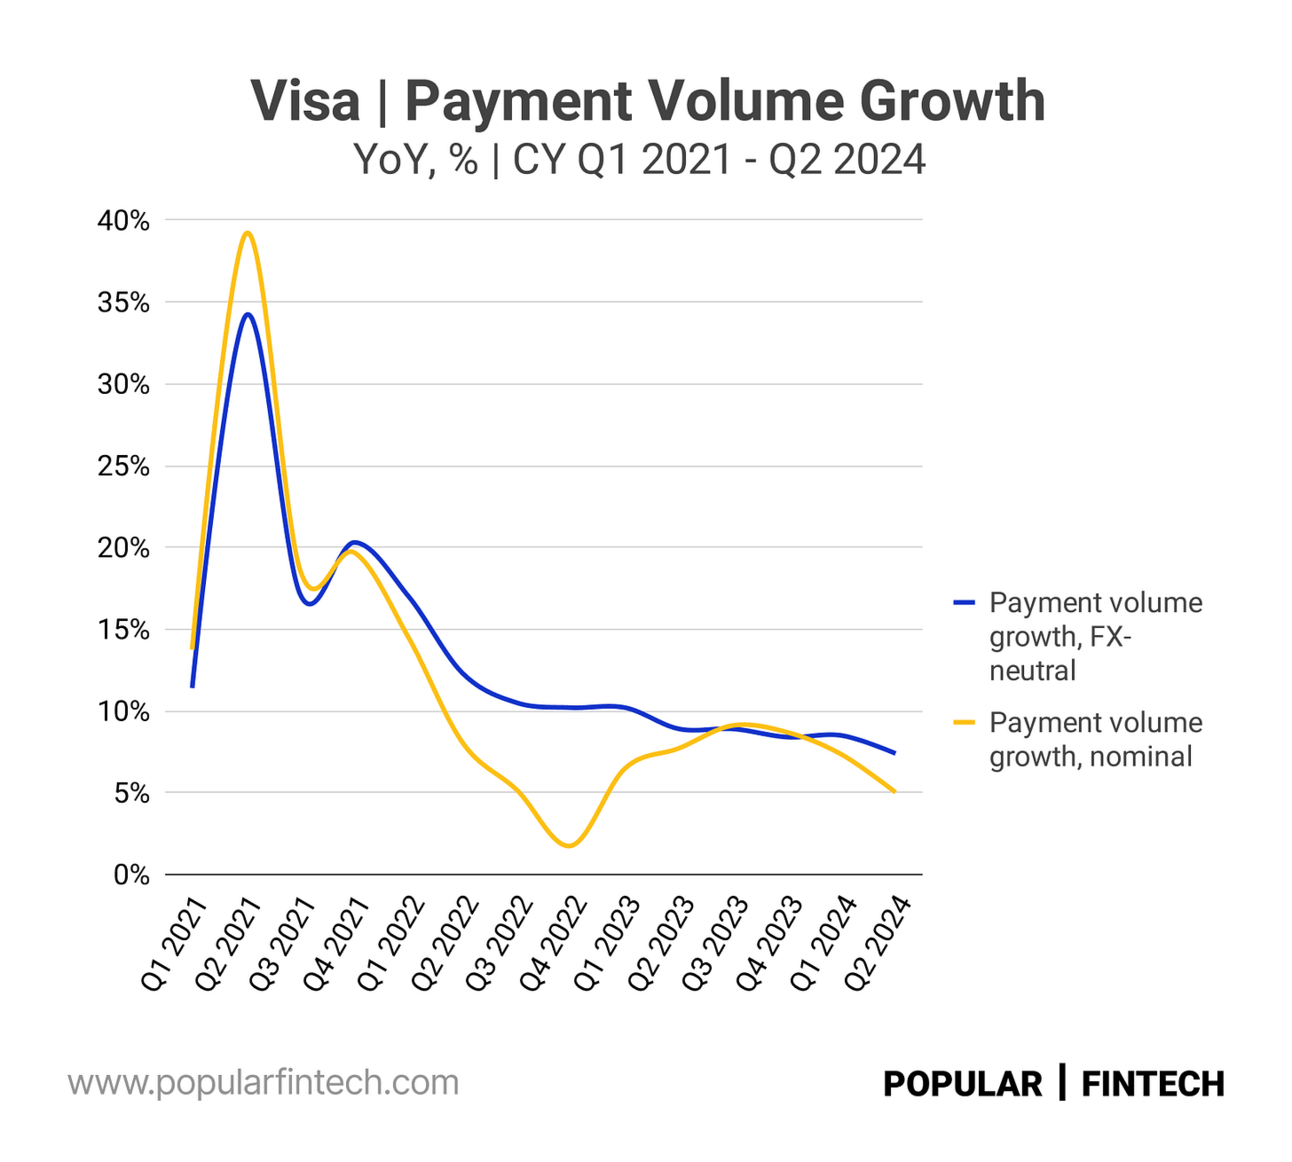
Payments volume represents the aggregate dollar amount of purchases made with cards and other form factors carrying the Visa, Visa Electron, V PAY and Interlink brands and excludes Europe co-badged volume.
However, payment volume growth differed materially across regions. Thus, Visa’s payment volume in the U.S. increased 5.1% YoY, while the payment volume in Europe increased 9.4% YoY in nominal terms and 12.6% YoY on an FX-neutral basis. As can be seen from the chart below, since calendar Q1 2023, Visa’s payment volume in Europe has been growing much faster in Europe than in the U.S.
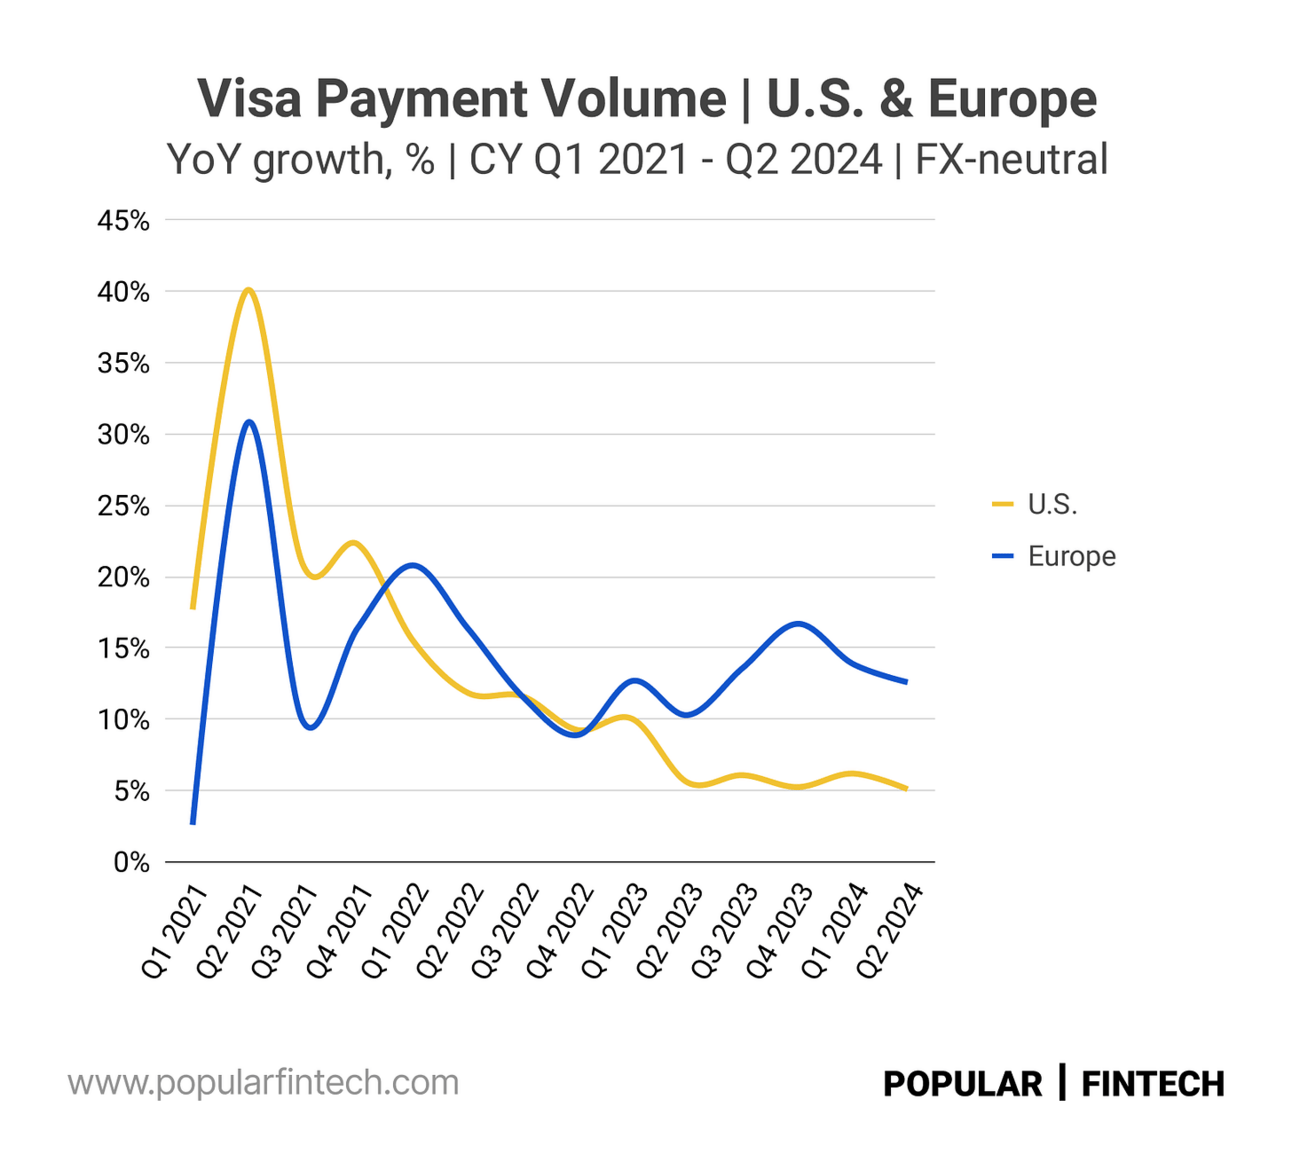
“Payments volume growth rates were strong for the quarter in most major regions, with Latin America, CEMEA, and Europe ex U.K. each growing more than 16% in constant dollars. Asia Pacific payments volume slowed to less than 0.5 point of year-over-year growth in constant dollars for the quarter, driven primarily by the macroeconomic environment, most notably in Mainland China.”
Visa Fiscal Q3 2024 earnings call
It is probably worth noting, that the U.S. is the largest market for Visa, representing more than 49% of the company’s payment volume in the last year. Europe is the second largest market for the company (19.7% of the payment volume), followed by Asia Pacific (15.6%) and Latin America and The Caribbean (6.8%).
By the way, despite Europe contributing less than 20% of the company’s payment volume, Visa is still bigger in Europe than Mastercard. Thus, in 2023, Visa’s payment volume in Europe was $2.4 trillion, compared to $2.3 trillion for Mastercard.

Visa’s payment volume in Asia Pacific declined 4.9% YoY in nominal terms and increased just 0.2% on an FX-neutral basis. Latin America and The Caribbean continue to be a bright spot for the company, with the payment volume increasing 7.9% YoY in nominal terms and 21.4% YoY on an FX-neutral basis.
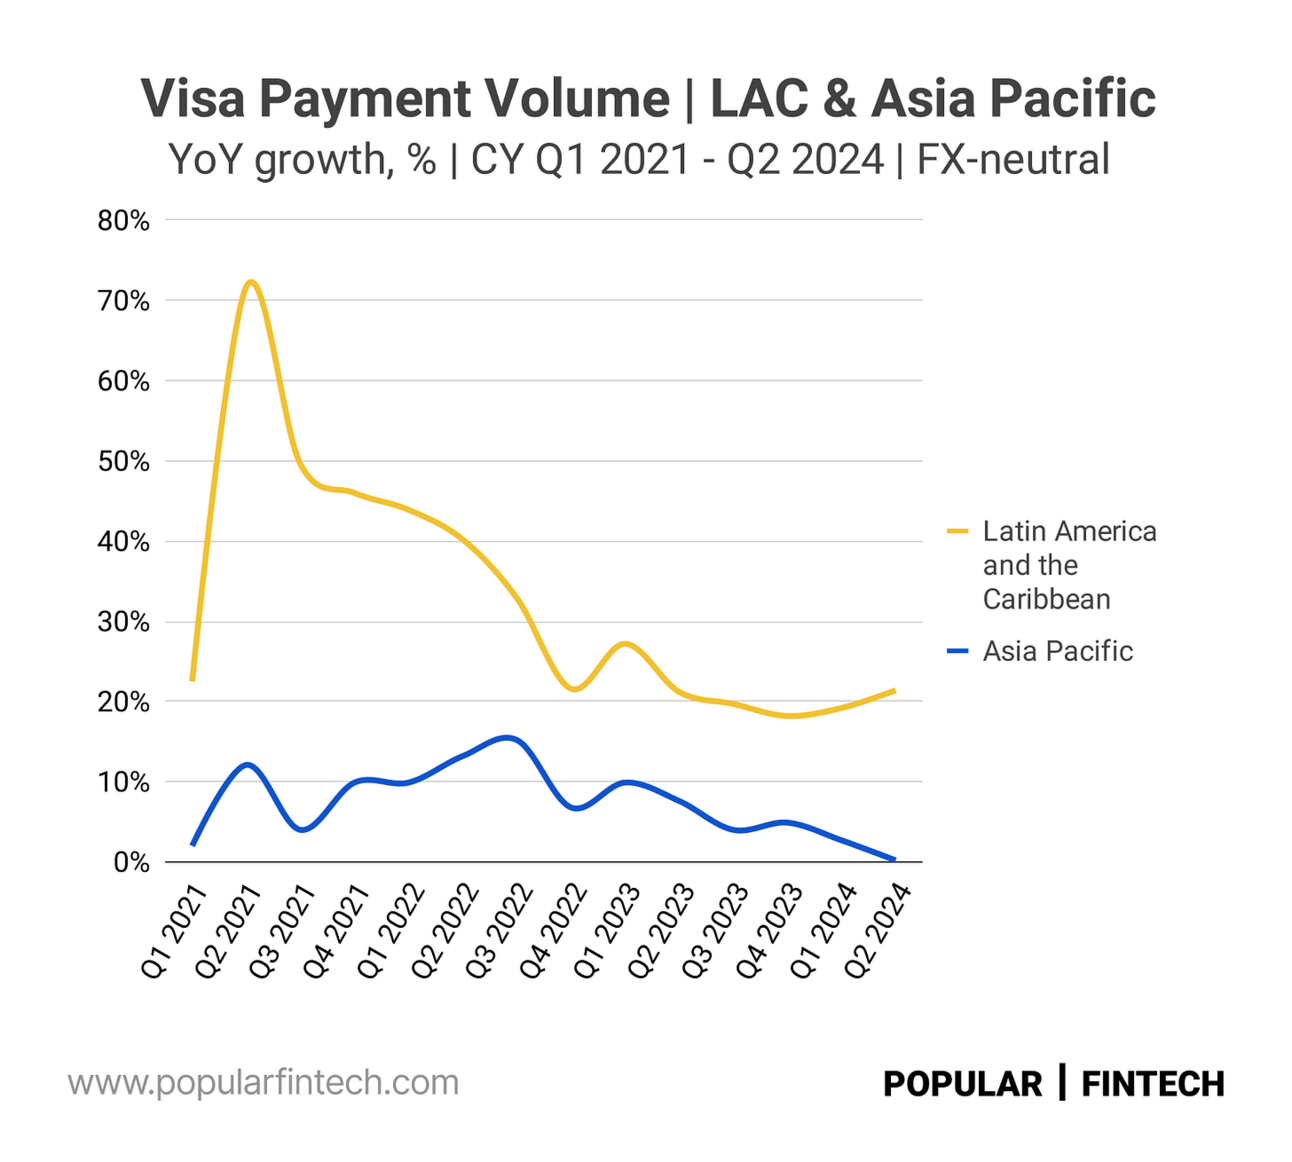
In summary, Visa’s payment volume in the U.S. grew 5.1% YoY. However, if we exclude the impact of currency fluctuations (the FX-neutral basis), the company’s payment volume grew in double digits in Europe, Latin America, as well as CEMEA (Central Europe, excluding the EU countries, Middle East and Africa).
Dollar appreciation hid this growth, so the double-digit growth in payment volume translated into single-digit service revenue growth. So my conclusion is that using Visa’s revenue growth, as a proxy for the health of the economy might be tricky. One should instead look at the payment volume growth by region on an FX-neutral basis.
“In the U.S., payment volumes growth numbers were generally in line with Q2 adjusted for leap year, with total Q3 payments volume growing 5% year-over-year, with credit and debit also growing 5%. Card-present volume grew 2% and card-not-present volume grew 7%.”
Visa Fiscal Q3 2024 earnings call
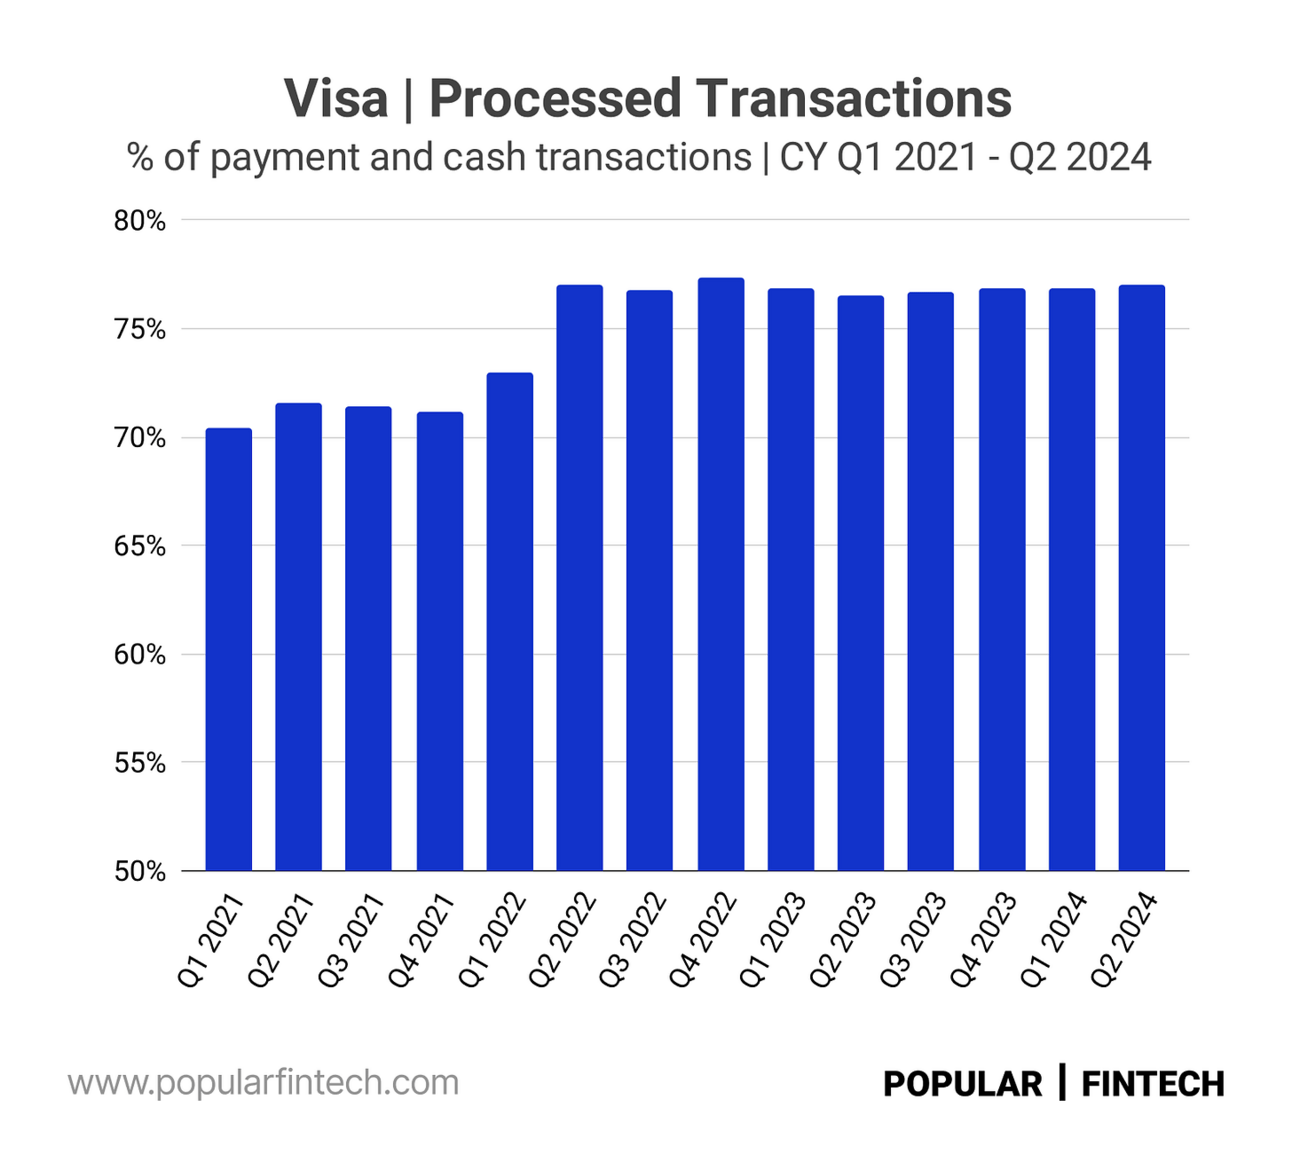
Now let’s talk about processed transactions, which is the driver for the data processing revenue. As one of the charts above illustrates, Visa’s data processing revenue has been growing slightly faster than service revenue lately. A simple explanation for this is that the processed transactions volume has been growing faster than the payment volume (see the chart below).

Processed transactions include payments and cash transactions, and represent transactions using cards and other form factors carrying the Visa, Visa Electron, V PAY, Interlink and PLUS brands processed on Visa’s networks.”
But it looks like there is more going on under the hood. Thus, the average payment transaction has been steadily declining for the past three years (see the chart below, but please note that the Y-axis starts at $40). The same payment volume (the dollar value of payments) translates into more payment transactions because the average transaction becomes smaller. And Visa charges these type of fees based on the transaction count.

In Q2 2022, there was also a jump in the share of transactions that are processed by Visa (as I mentioned above, not all Visa card transactions are processed by Visa). I think this is related to Visa suspending its operations in Russia, after the invasion of Ukraine. I’d guess Visa cards in Russia contributed to the total payment volume, but were processed locally (e.g. by the Mir network).
However, there is even more to that. In Fiscal Q3 2024, Visa generated “over $2 billion in revenue” from Value-Added Services (VAS). These are different software solutions and advisory services that Visa sells to issuers and acquirers. They are not reported separately, but rather split between the data processing and other revenues.
“We've had consistent strong performance in VAS [ Value-Added Services ], over $2 billion of revenue, over 20% growth for many quarters consecutively. And we're seeing strength across the business in Issuing Solutions and Acceptance and Advisory. That's a business that we feel great about the momentum in.”
Visa Fiscal Q3 2024 earnings call
Lots of things are going on with data processing revenues and processed transactions. However, I’d concluded that those are relevant data points for Visa, but those add very little to the information that can be deducted from the payment volume. Growth in Value-Added Services, a higher share of processed transactions…all contribute to Visa’s bottom line, but provide few insights into what is happening with the economy or consumers.
Now let’s discuss cross-border volumes, which is the driver for Visa’s international transaction revenues. As can be seen from the chart below, cross-border volume grew in the high teens during 2023, but started slowing down in 2024. Similar to the service revenue, growth in cross-border volumes is partially hidden by the appreciation of the dollar (just look at the difference in the growth rates in nominal terms and on an FX-neutral basis).
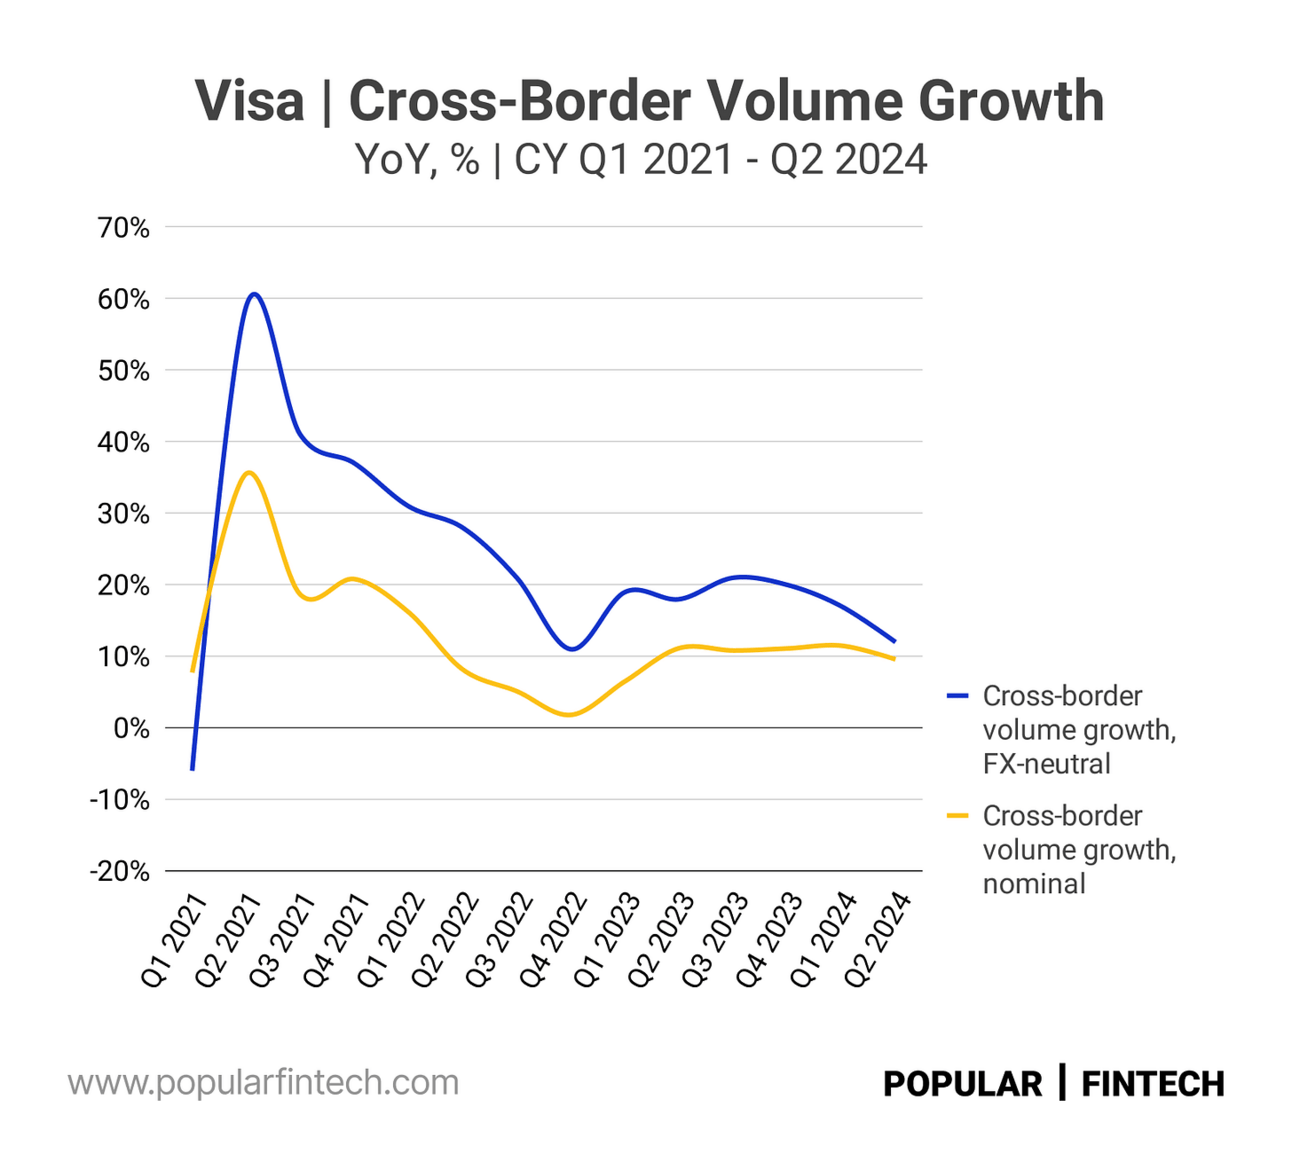
What is interesting about the cross-border volume is that, according to Visa’s management comments, it is not only about travel (people using their cards in different countries). Thus, “roughly 40%” of cross-border volume apparently are e-commerce transactions with consumers buying goods and services from merchants located in other countries.
“Pre pandemic, cross-border grew, travel grew in the high single digits to low double digits, and e-commerce, which is about 1/3 of the business, grew into the teens, sometimes into the mid-teens. Obviously, the pandemic happened. Travel really contracted, e-commerce grew faster and since then, now post pandemic, what we're seeing that e-commerce is roughly 40% of the business.”
Visa Fiscal Q3 2024 earnings call
Thus, Visa’s cross-border volume can actually be used to make conclusions about cross-border e-commerce growth. Unfortunately, Visa does not provide any geographical splits of this metric, but cross-border volume, unlike processed transactions, adds additional insights to the information provided by the payment volume (I am thinking about Amazon, Shopify, Adyen, and Stripe here).
Finally, let’s discuss client incentives. Again, incentives are a portion of fees that Visa returns to its clients upon them reaching certain performance indicators. Client incentives are contra revenue, or a deduction from gross revenue. As can be seen from the chart below, incentives represent 26-28% of Visa’s gross revenue (please note that the Y-axis starts at 20%).
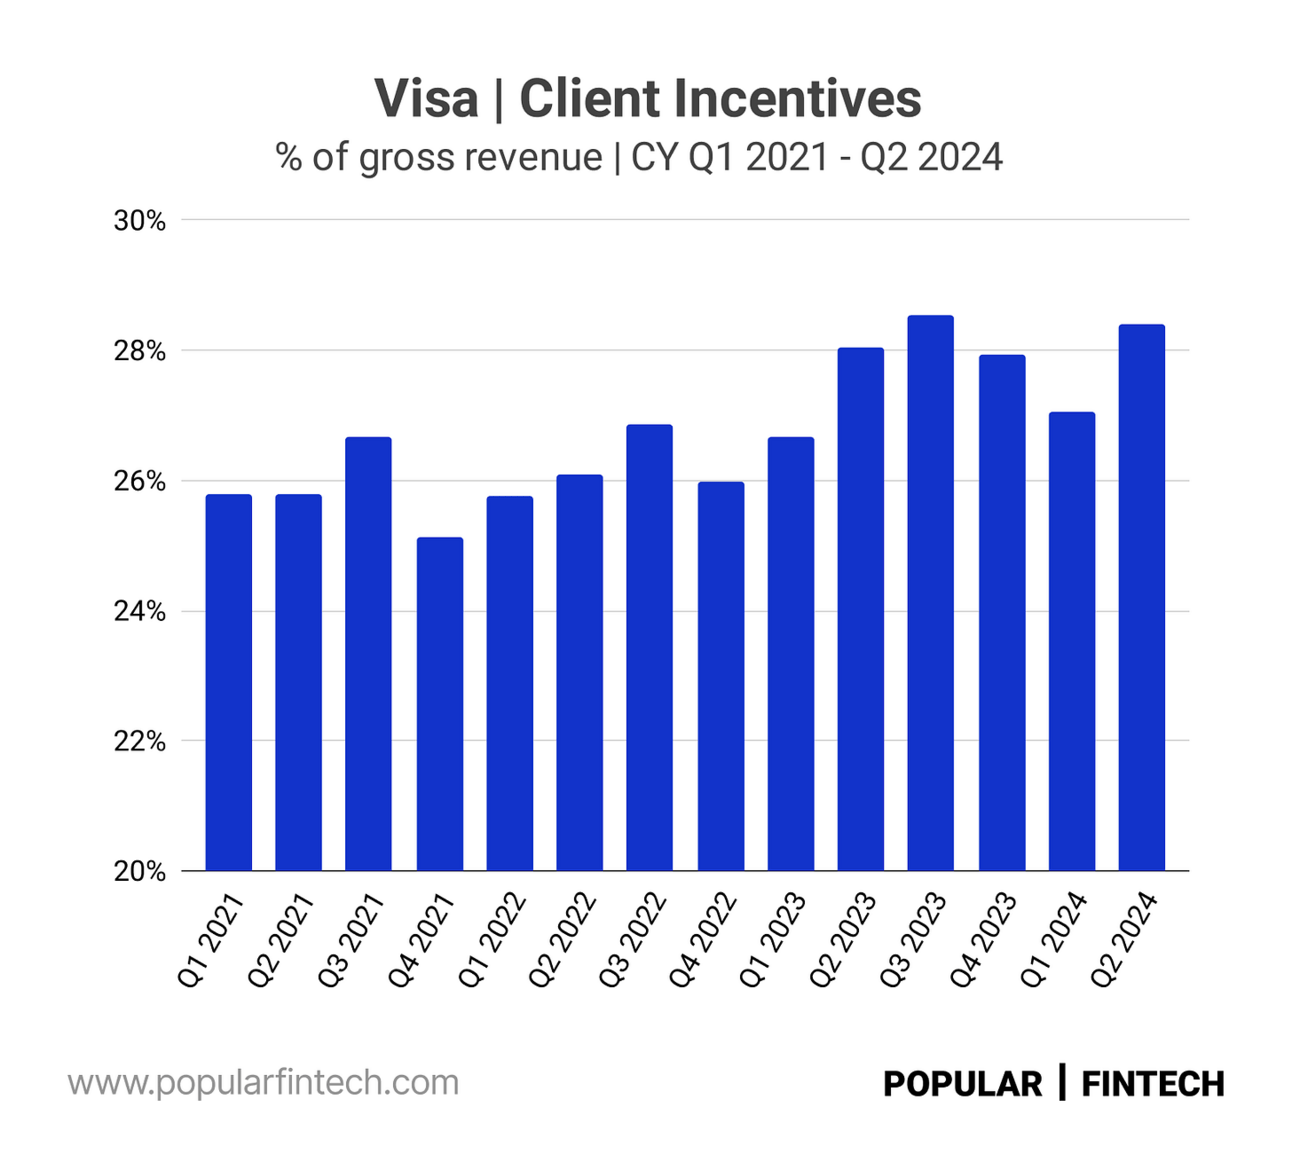
I’d say currency exchange rate fluctuations and client incentives are the key reasons why using Visa’s revenue growth to make any broader conclusions about the economy is not correct. As I wrote above, currency exchange distorts or hides the true growth in various regions (payment volume on an FX-neutral basis is a much better indicator).
Incentives are linked to the performance of an issuer or an acquirer. So, in theory, higher payment volume growth rates might result in Visa having to pay higher incentives. However, per the comments on the earnings calls, the key driver for higher incentives is the renegotiation of client agreements. Thus, incentives, to some degree, reflect the competition dynamics, rather than true underlying growth.
Moreover, part of the paid (or booked) incentives comes back to Visa through Value-Added Services. Thus, Visa would offer part of the incentives in the form of its consulting services (“value in-kind”) instead of cash. Incentives (a contra revenue) would be booked in one period, and the revenue from Value-Added Services would be booked in a different period (when an issuer or an acquirer uses Visa’s consulting services).
“The value in-kind is a great way for us, as it says, to deliver value to our clients. And increasingly, our clients, as you see in our performance are preferring to buy our value-added services versus just take incentives that might drop to the bottom line. So that is absolutely something that our clients are asking for more of.”
Visa Fiscal Q3 2024 earnings call
In summary, incentives impact Visa’s net revenue growth, but are hardly an indication of the underlying payment volume growth. Instead, incentives reflect competition dynamics with Mastercard, as well as Visa’s effort to push Value-Added Services.
Alright…given what we have just learned, what can we deduct from Visa’s guidance for the next quarter? Thus, Visa guides for “low double-digit” net revenue growth (see the table below). However, as discussed above, using Visa’s net revenue to make any broader conclusions is tricky (due to currency fluctuation that distorts international growth and client incentives).

“We expect payments volume and processed transactions to grow at a similar rate to Q3. For total cross-border volume growth, we are expecting to end up slightly below Q3.”
Visa, Fiscal Q3 2024 earnings call
However, we can use management’s comments about the payment volume. Thus, Visa’s management expects payment volume to grow at “a similar rate to Fiscal Q3 2024”, and cross-border volume to grow slightly below the Q3 growth rate.
This would mean 5% YoY growth in the U.S. (and a lower growth rate for “card present”, or in-person, volumes and a higher growth rate for e-commerce volumes), and double-digit growth in Europe, Latin America, as well as the CEMEA region. A further slowdown in the cross-border volume growth suggests a headwind for e-commerce growth.
Next week PayPal and Block will report their Q2 2024 results, followed by Shopify and Global Payments the week after. Let’s see if Visa’s results and the guidance gave us some insights into the performance of these companies.
I am thinking about PayPal’s growth in Europe (a bright spot for the company in the last few quarters), Square falling behind the competition on payment volume growth (primarily U.S. card present payments), and acceleration in Shopify’s gross merchandise volume (the opposite direction to Visa’s cross-border volumes).
Until then…thank you for reading!
Cover image source: Visa
Disclaimer: Information contained in this newsletter is intended for educational and informational purposes only and should not be considered financial advice. You should do your own research or seek professional advice before making any investment decisions.
