
Fintech companies, like most technology startups, love picking a “villain” or an industry that they will “disrupt”. Usually, those are the banks, but sometimes, Fintech companies aim to disrupt the card schemes, such as VISA and Mastercard (think of Affirm, Afterpay, and other BNPL players). The card schemes would be portrayed as outdated and greedy legacies of the past.
Nevertheless, I would argue that the ubiquitous acceptance of payment cards is probably one of the most important innovations in the financial sector, and the card schemes like VISA and Mastercard played an important part in its success. Just imagine traveling without your VISA or Mastercard payment card: checks, cash, currency exchanges….no one wants that.
So today I wanted to show a few charts illustrating the scale that VISA and Mastercard have reached. These two companies perfectly illustrate what a product-market fit and a global adoption mean for a financial technology company. We are talking trillions of dollars in processed payments and billions of dollars in profits…but let the charts tell the story!
Number of Cards
There were 3.92 billion VISA and 2.52 billion Mastercard cards in circulation at the end of Q1 2022. Over the last 10 years, the number of VISA cards grew at a Compound Annual Growth Rate (CAGR) of 6.8%, while the number of Mastercard cards grew at a CAGR of 8.7%.
During 2011 - 2022, the World’s population grew at a CAGR of just 1.2%, so both VISA and Mastercard outpaced the population growth in terms of the number of cards. It is staggering, that VISA and Mastercard had 6.44 billion cards in circulation on a planet with fewer than 8 billion people (and these are not the only card schemes out there).
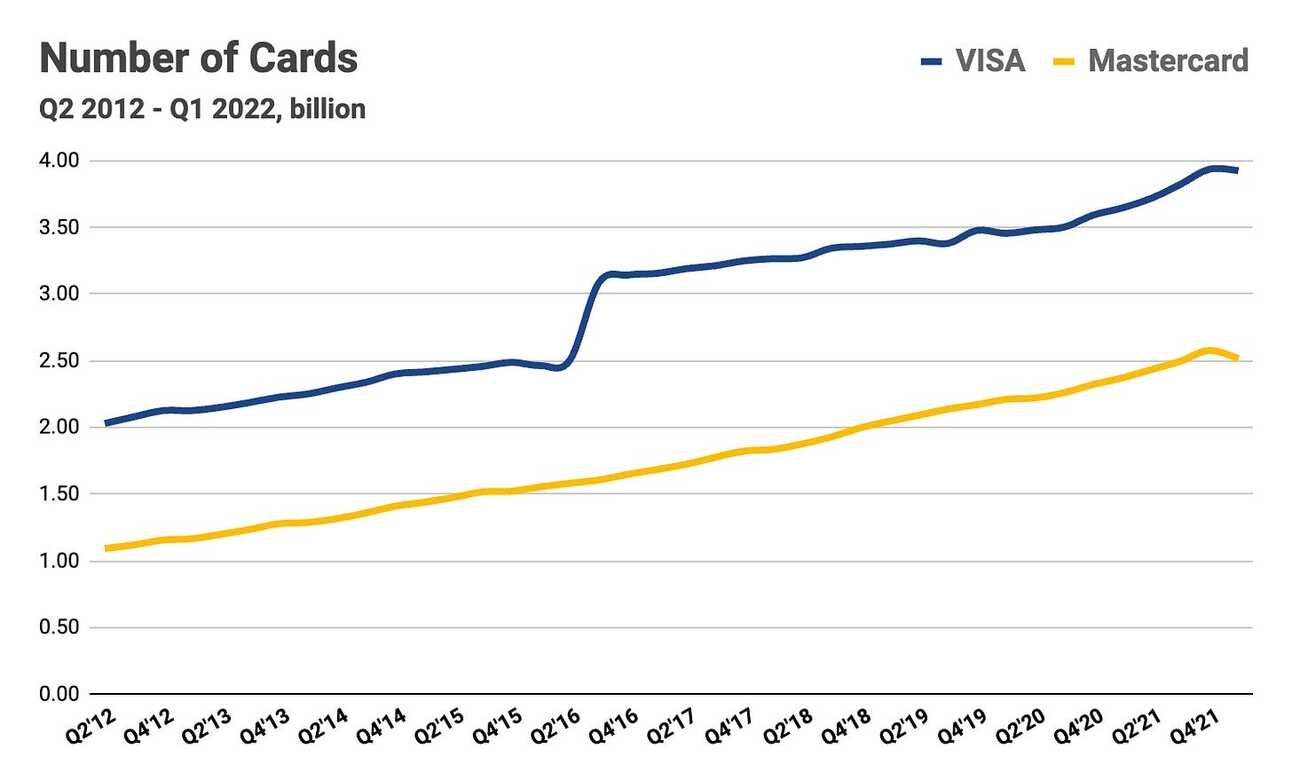
Please note, that in 2016 Visa Inc. acquired VISA Europe (you can see a jump on all charts in Q3 2016), which inflates CAGR numbers over a 10-year period. VISA Europe was separated from VISA Inc. prior to the company’s IPO in 2008.
Payment Volume
In Q2 2022, VISA reported a Payment Volume, or the total value of card transactions excluding cash withdrawals and deposits, of $2.94 trillion (correct, this is trillion!), while Mastercard reported a Payment Volume of $1.65 trillion. Over the last 10 years, VISA’s quarterly Payment Volume grew at a CAGR of 11.3%, while Mastercard’s Payment Volume grew at a CAGR of 9.3%.
VISA surpassed $1 trillion in quarterly payment volume in Q3 2012, and Mastercard reached this milestone five years later in Q4 2017. Both card schemes experienced a sharp drop in payment volume at the onset of the pandemic (Q2 2020), but were back to growth already in the following quarter (Q3 2020).
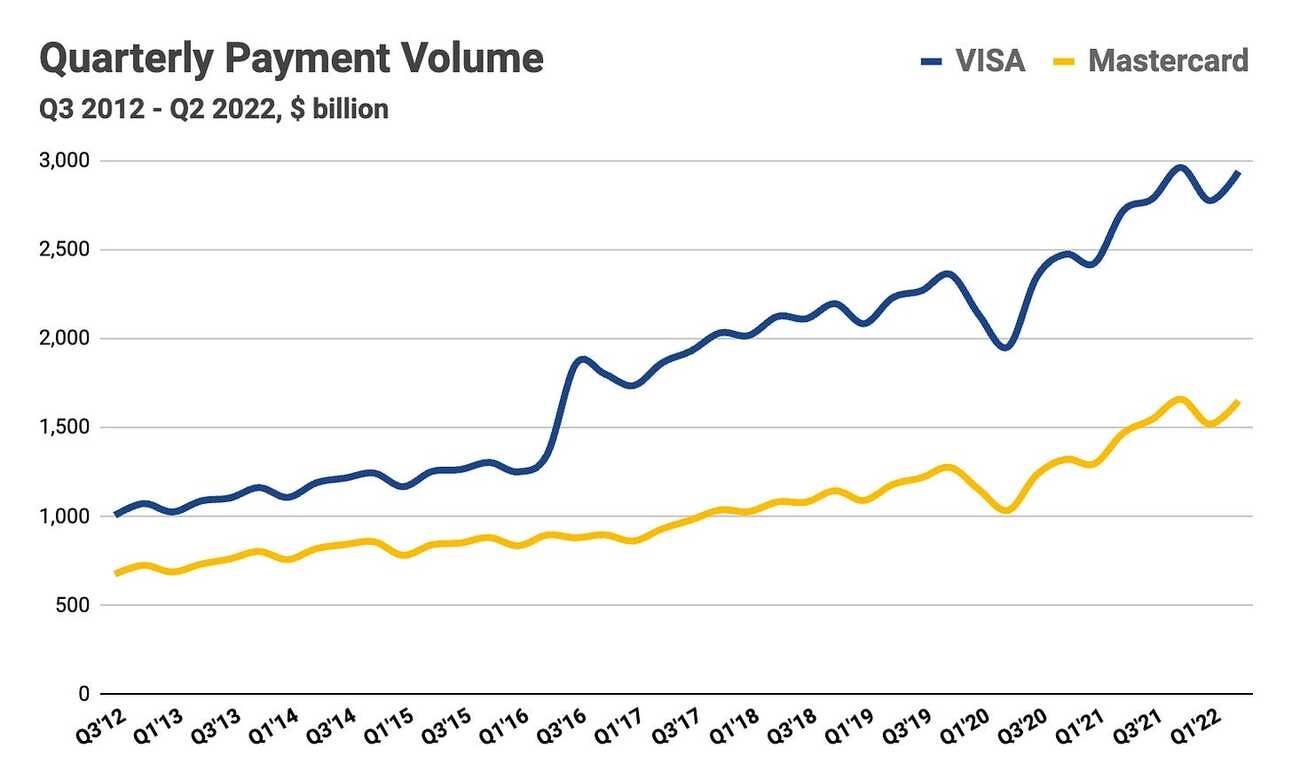
In 2021, VISA and Mastercard reported a Payment Volume of $10.89 trillion and $5.96 trillion respectively. During the last twelve reported months (Q3 2021 - Q2 2022), VISA processed a payment volume of $11.46 trillion, while Mastercard processed a payment volume of $6.38 trillion.
Revenue
In Q2 2022, VISA reported revenue of $7.28 billion, while Mastercard reported revenue of $5.50 billion. Over the last 10 years, VISA grew its quarterly revenue at a CAGR of 10.3%, while Mastercard grew its quarterly revenue at a CAGR of 11.1%.
VISA and Mastercard earn most of their revenue from processing card transactions (charging both issuers and acquirers), so the growth in payment volume translates into revenue growth. What’s notable is that VISA’s take rate (Revenue / Payment and Cash Volume) increased from 0.17% in Q3 2012 to 0.20% in Q2 2022, and Mastercard’s take rate increased from 0.21% in Q3 2012 to 0.40% in Q2 2022.
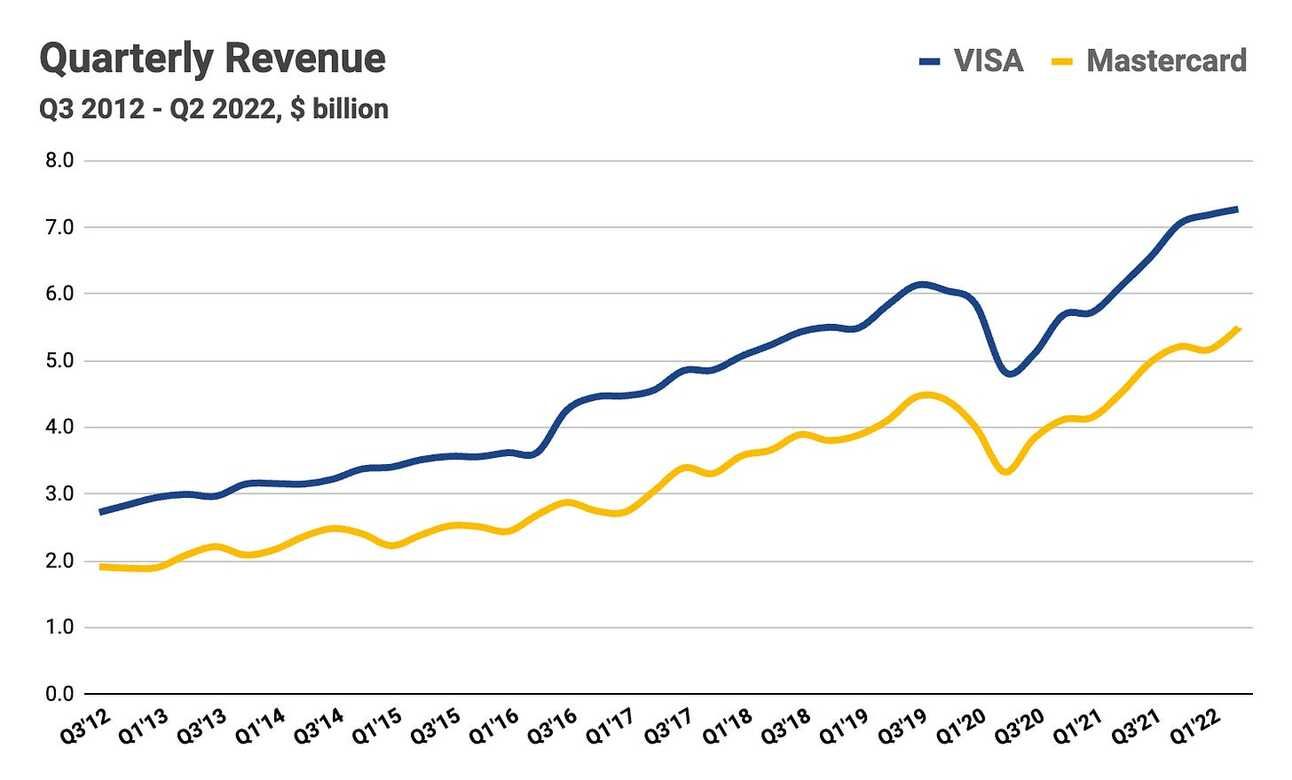
In 2021, VISA and Mastercard reported net revenue of $24.1 billion and $18.9 billion respectively. During the last twelve months (Q3 2021 - Q2 2022), VISA reported revenue of $28.08 billion, while Mastercard reported revenue of $20.87 billion.
Net Income
In Q2 2022, VISA reported a Net Income of $3.14 billion, while Mastercard reported a Net Income of $2.28 billion. Over the last 10 years, VISA’s quarterly Net Income grew at a CAGR of 7.5%, while Mastercard’s Net Income grew at a CAGR of 11.4%.
It’s been more than 10 years since VISA reported a quarterly Net Loss (Q2 2012), and it’s been even longer in the case of Mastercard (Q2 2008). Even the COVID-19 pandemic could not derail the companies from posting Net income.
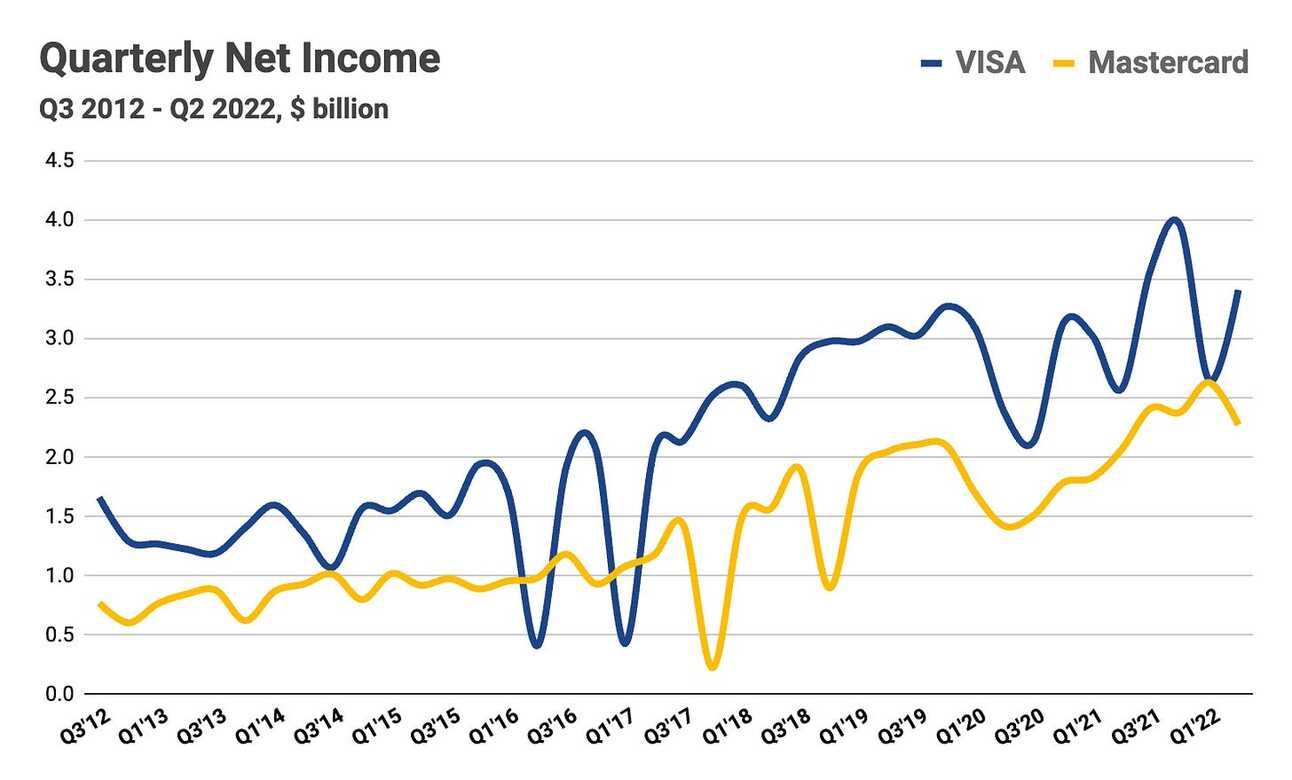
In 2021, VISA and Mastercard reported Net Income of $12.3 billion and $8.7 billion respectively. During the last twelve months (Q3 2021 - Q2 2022), VISA reported a Net Income of $13.60 billion, while Mastercard reported a Net Income of $9.7 billion.
Market Capitalization
At the end of Q2 2022, VISA’s market capitalization was $409.56 billion, while Mastercard’s market capitalization was $306.85 billion. Over the last 10 years, VISA’s market capitalization grew at a CAGR of 16.4%, while Mastercard’s market capitalization grew at a CAGR of 18.5%.
Just to illustrate the scale of VISA and Mastercard: at the end of Q2 2022, PayPal’s market capitalization was $80.88 billion, Block’s market capitalization was $35.76 billion and Shopify’s market capitalization was $39.41 billion.
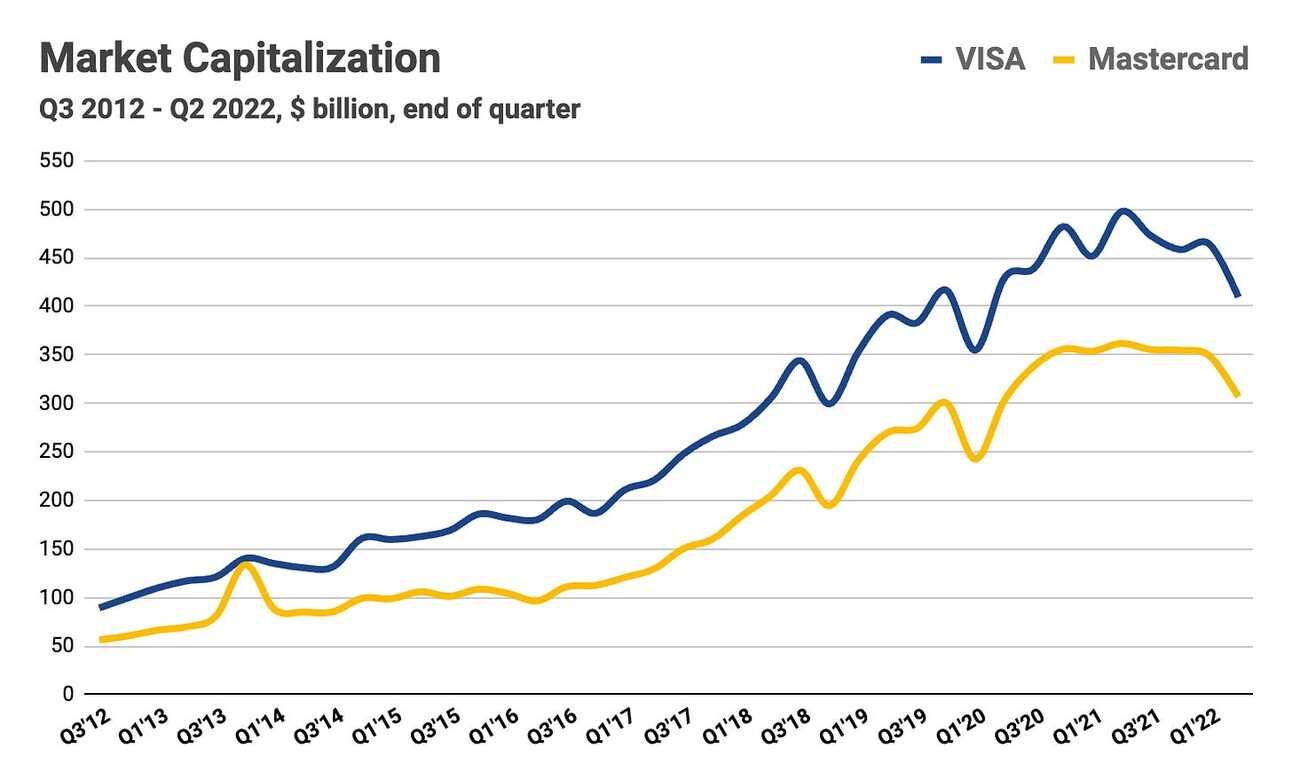
VISA’s market capitalization peaked at $533.44 billion on July 27, 2021, while Mastercard’s market capitalization peaked at $393.02 billion on April 28, 2021. At the end of Q3 2022, VISA and Mastercard had a market capitalization of $367.53 billion and $274.78 billion respectively.
Share Price Performance
VISA’s share price advanced 530%, while Mastercard’s share price advanced 633% over the Q3 2012 - Q2 2022 period (July 2, 2012 - June 29, 2022). At their respective peaks, VISA’s share price was up 692%, while Mastercard’s share price was up 801% compared to July 2, 2012.
$1,000 invested in VISA and Mastercard shares on July 2, 2012, were respectively worth $6,301 and $7,333 on June 29, 2022, and $5,611 and $6,464 on September 30, 2022. And this does not account for the dividends paid during this period.
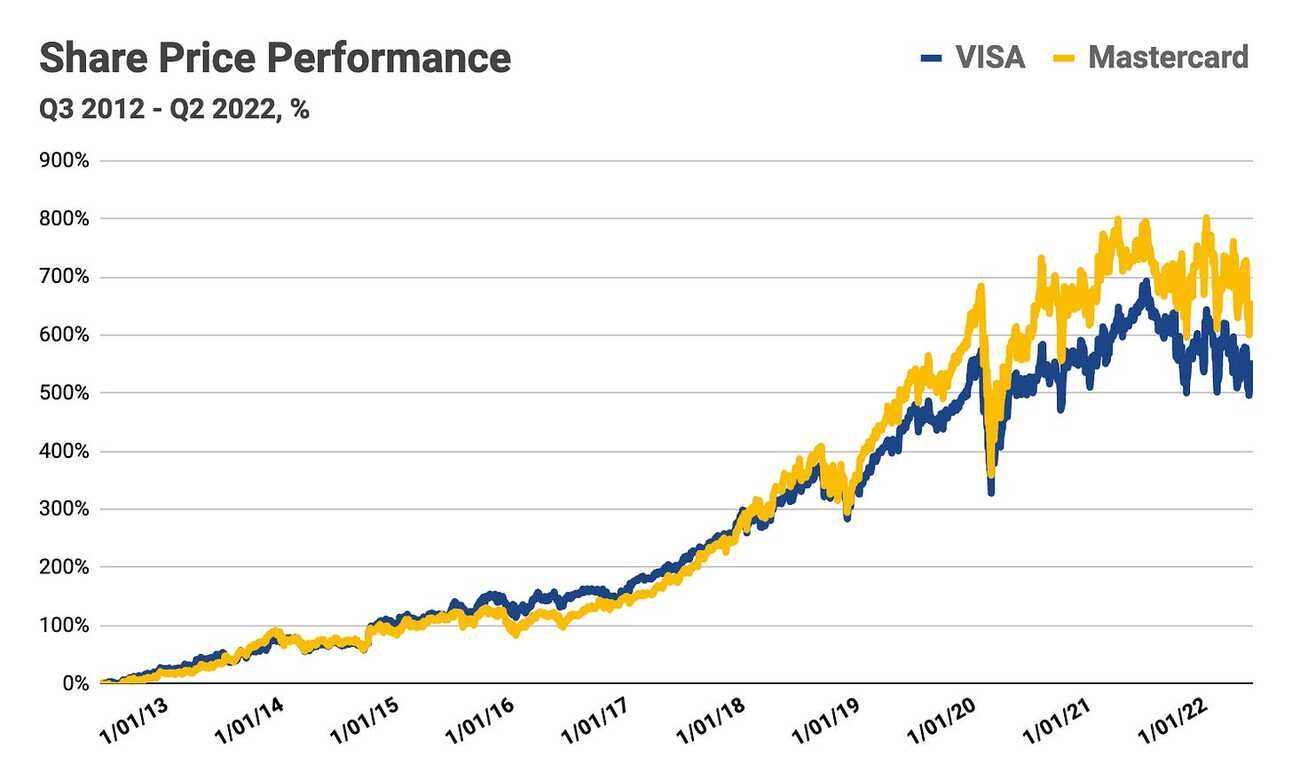
Some context on the performance of VISA and Mastercard share prices: during the same period, Q3 2012 - Q2 2022 (July 2, 2012 - June 29, 2022), S&P 500 advanced 177%, and NASDAQ Composite advanced 273%.
Disclosure & Disclaimer: despite rocky performance in 2021 and 2022, I own shares in most of the companies that I write about in this newsletter, as I am extremely bullish on the transformation in the financial services industry. However, none of the above is financial advice, and you should do your own research.